
AutoScaling 에 대해
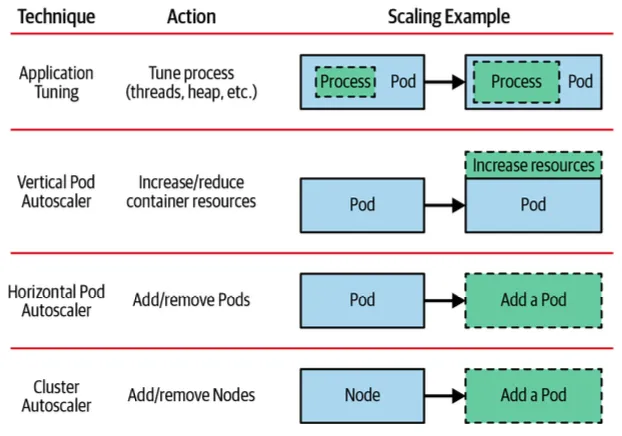
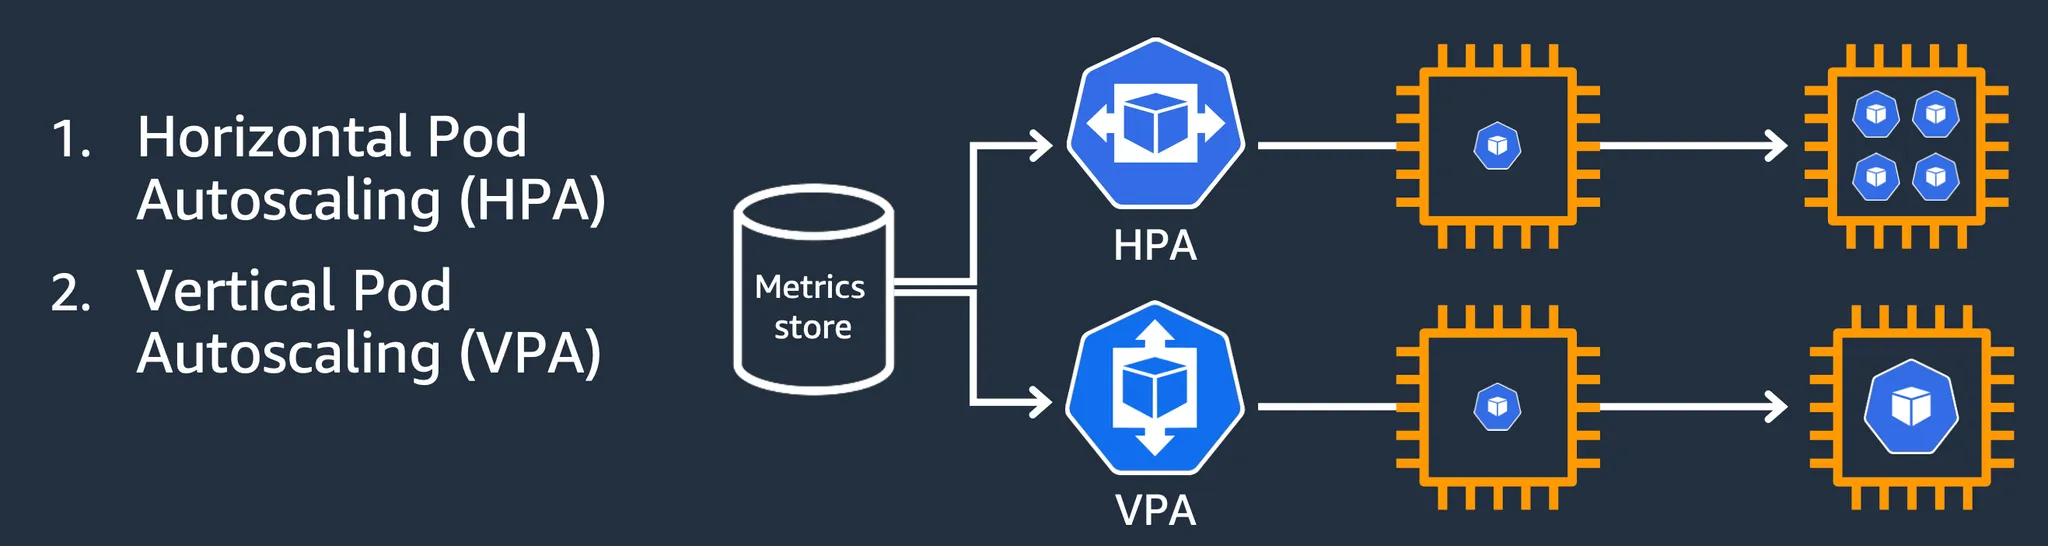
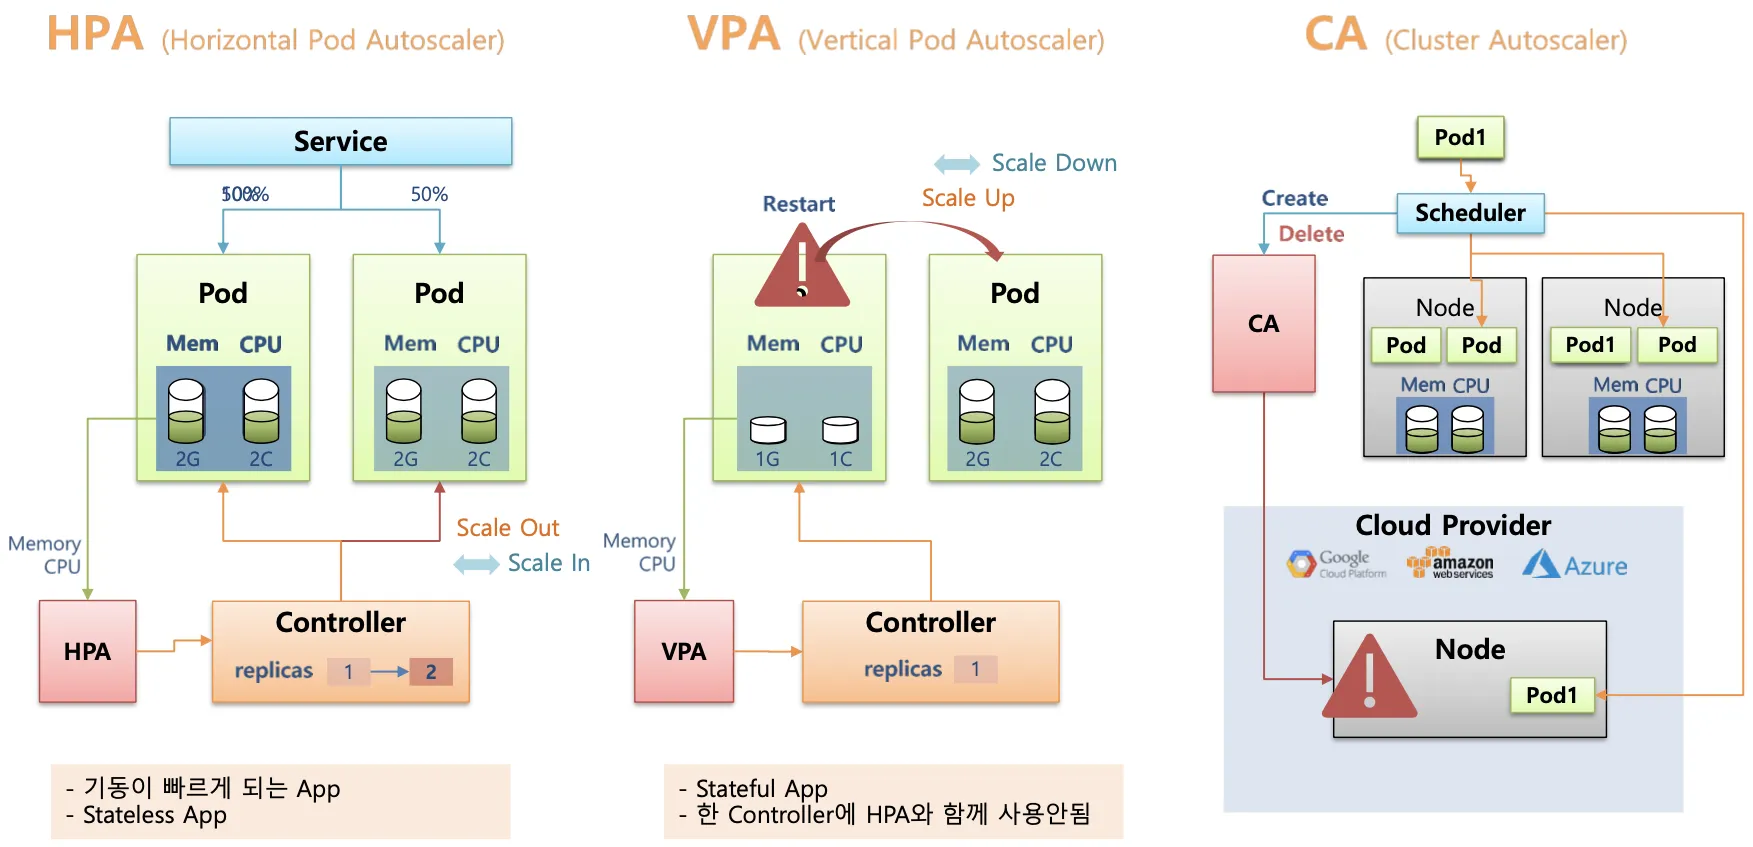
Vertical Pod Autoscaler (VPA) : Pod의 리소스(cpu, mem 등)를 동적으로 증가 또는 감소시켜 성능을 조정
Horizontal Pod Autoscaler (HPA) : 부하에 따라 pod의 개수를 자동으로 추가하거나 제거하여 확장성을 제공
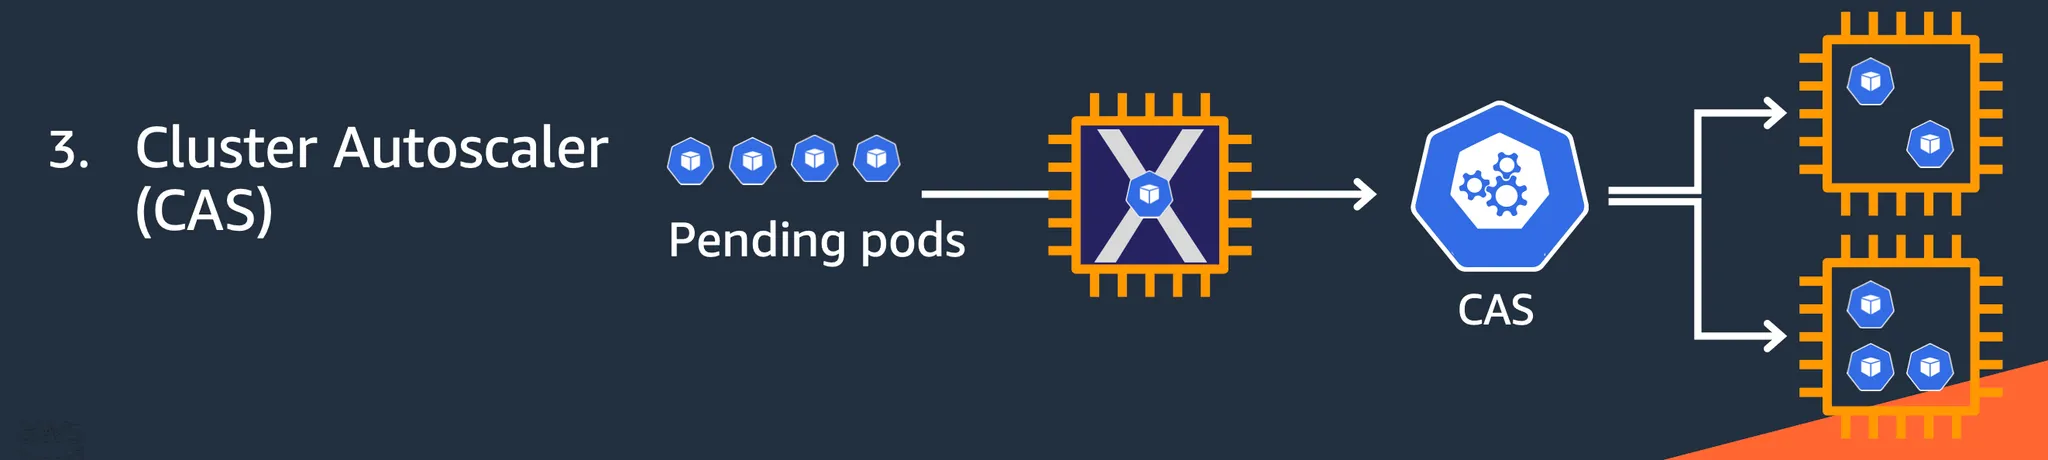
Cluster Autoscaler : 클러스터의 노드를 자동으로 추가하거나 제거하여 전체적인 리소스 사용을 최적화
실습 환경 배포
# YAML 파일 다운로드
curl -O https://s3.ap-northeast-2.amazonaws.com/cloudformation.cloudneta.net/K8S/myeks-5week.yaml

# 변수 지정
CLUSTER_NAME=myeks
SSHKEYNAME=<SSH 키 페이 이름>
MYACCESSKEY=<IAM Uesr 액세스 키>
MYSECRETKEY=<IAM Uesr 시크릿 키>

# CloudFormation 스택 배포
aws cloudformation deploy --template-file myeks-5week.yaml --stack-name $CLUSTER_NAME --parameter-overrides KeyName=$SSHKEYNAME SgIngressSshCidr=$(curl -s ipinfo.io/ip)/32  MyIamUserAccessKeyID=$MYACCESSKEY MyIamUserSecretAccessKey=$MYSECRETKEY ClusterBaseName=$CLUSTER_NAME --region ap-northeast-2

# CloudFormation 스택 배포 완료 후 작업용 EC2 IP 출력
aws cloudformation describe-stacks --stack-name myeks --query 'Stacks[*].Outputs[0].OutputValue' --output text

# 작업용 EC2에서 설치 확인
ssh -i <SSH Key 파일> ec2-user@$(aws cloudformation describe-stacks --stack-name myeks --query 'Stacks[*].Outputs[0].OutputValue' --output test)

# 설치 로그 확인
tail -f /root/create-eks.log

# 설치가 완료되면 Cluster 정보 확인
k cluster-info
k get node --label-columns=node.kubernetes.io/instance-type,eks.amazonaws.com/capacityType,topology.kubernetes.io/zone
k get pod -A
k get pdb -n kube-system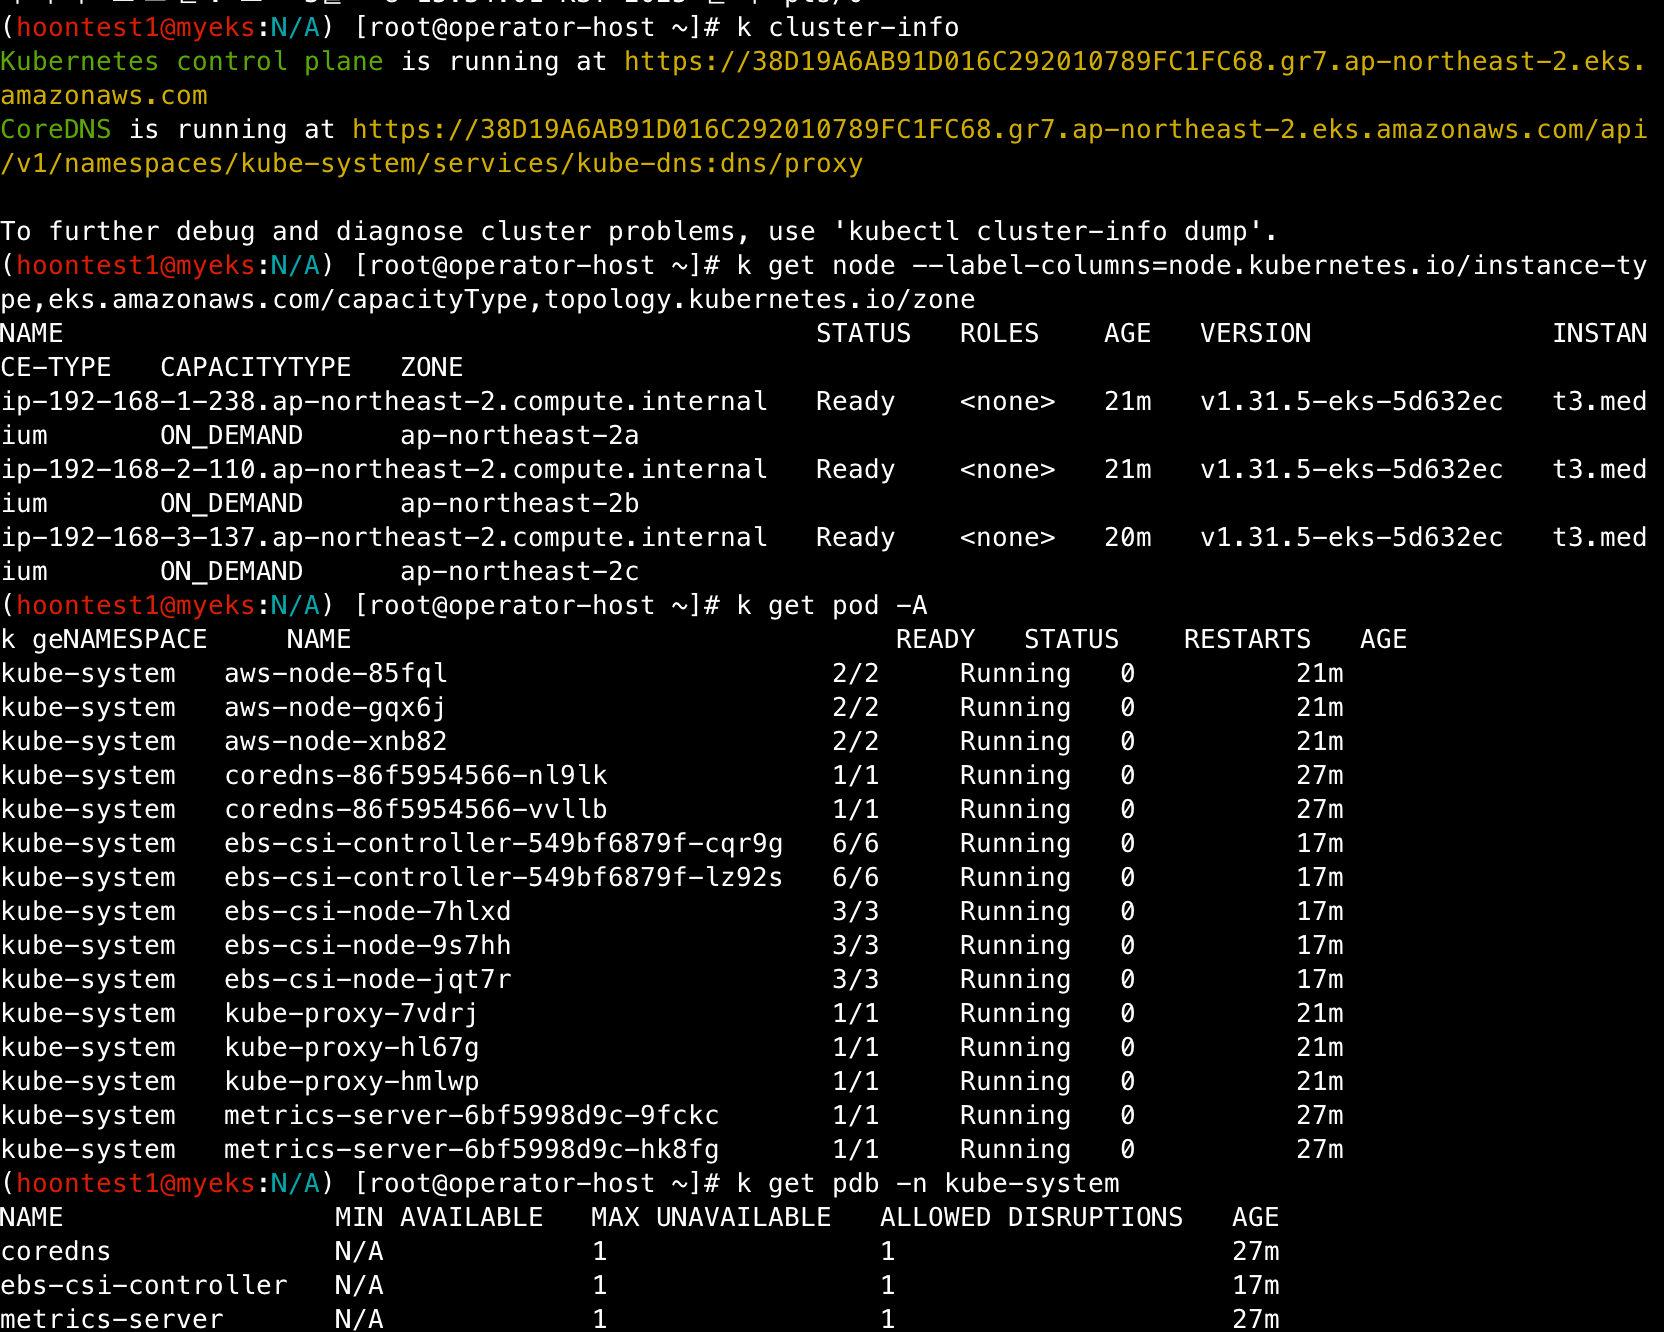
로컬 PC에서 kube_config 업데이트 및 클러스터 정보 확인
## 변수 지정
CLUSTER_NAME=myeks
SSHKEYNAME=<SSH KEY NAME>
## 클러스터 확인
eksctl get cluster
## kube-config 업데이트
aws sts get-caller-identity --query Arn
aws eks update-kubeconfig --name myeks --user-alias <위 명령어 출력 사용자>
## 클러스터 정보 확인
k ns default
k get node --label-columns=node.kubernetes.io/instance-type,eks.amazoneaws.com/capacityType,topology.kubernetes.io/zone
k get pod -A
k get pdb -n kube-system
## EC2 공인 IP 변수 지정
export N1=$(aws ec2 describe-instances --filters "Name=tag:Name,Values=myeks-ng1-Node" "Name=availability-zone,Values=ap-northeast-2a" --query 'Reservations[*].Instances[*].PublicIpAddress' --output text)
export N2=$(aws ec2 describe-instances --filters "Name=tag:Name,Values=myeks-ng1-Node" "Name=availability-zone,Values=ap-northeast-2b" --query 'Reservations[*].Instances[*].PublicIpAddress' --output text)
export N3=$(aws ec2 describe-instances --filters "Name=tag:Name,Values=myeks-ng1-Node" "Name=availability-zone,Values=ap-northeast-2c" --query 'Reservations[*].Instances[*].PublicIpAddress' --output text)
echo $N1, $N2, $N3
## RemoteAccess ID 변수 지정
aws ec2 describe-security-groups --filters "Name=group-name,Values=*remoteAccess*" | jq
export MNSGID=$(aws ec2 descirbe-security-groups --filters "Name=group-name,Values=*remoteAccess*" --query 'SecurityGroups[*].GroupId' --output text)
## 원격 접속을 위한 방화벽 룰 추가
aws ec2 authorize-security-group-ingress --group-id $MNSGID --protocol '-1' --cidr $(curl -s ipinfo.io/ip)32
## 보안 inbound에 사설 IP 룰 추가
aws ec2 authorize-security-group-ingress --group-id $MNSGID --protocol '-1' --cidr 172.20.1.100/32
## 워커 노드 접속 테스트
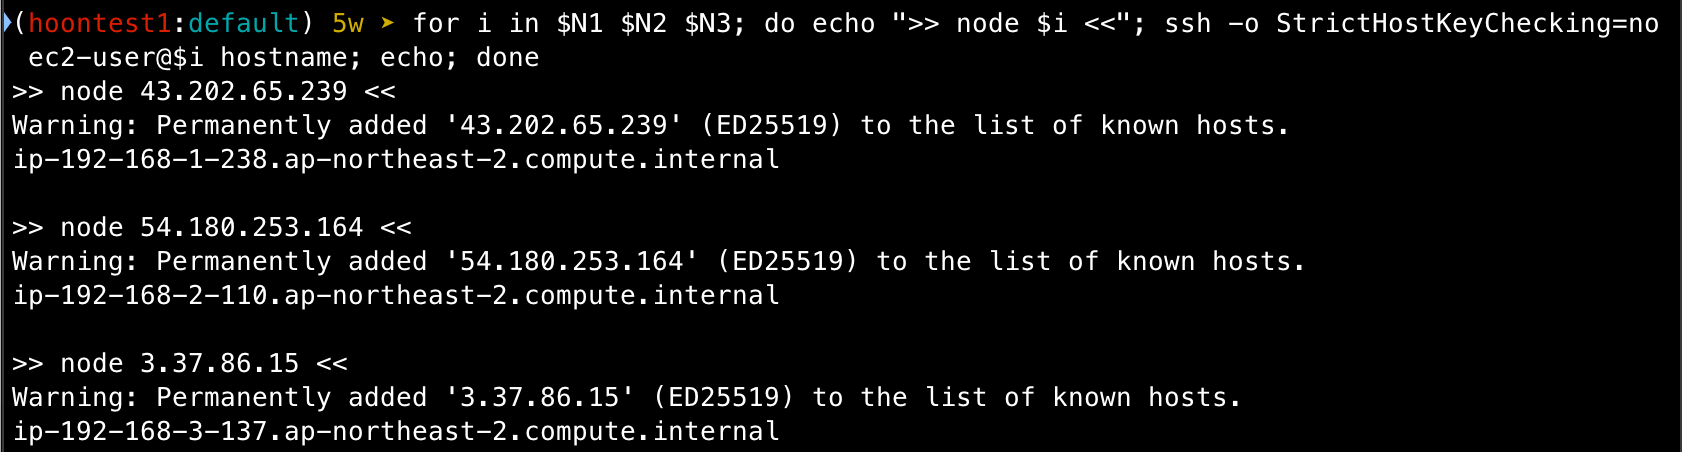
for i in $N1 $N2 $N3; do echo ">> node $i <<"; ssh -o StrictHostKeyChecking=no ec2-user@$i hostname; echo; done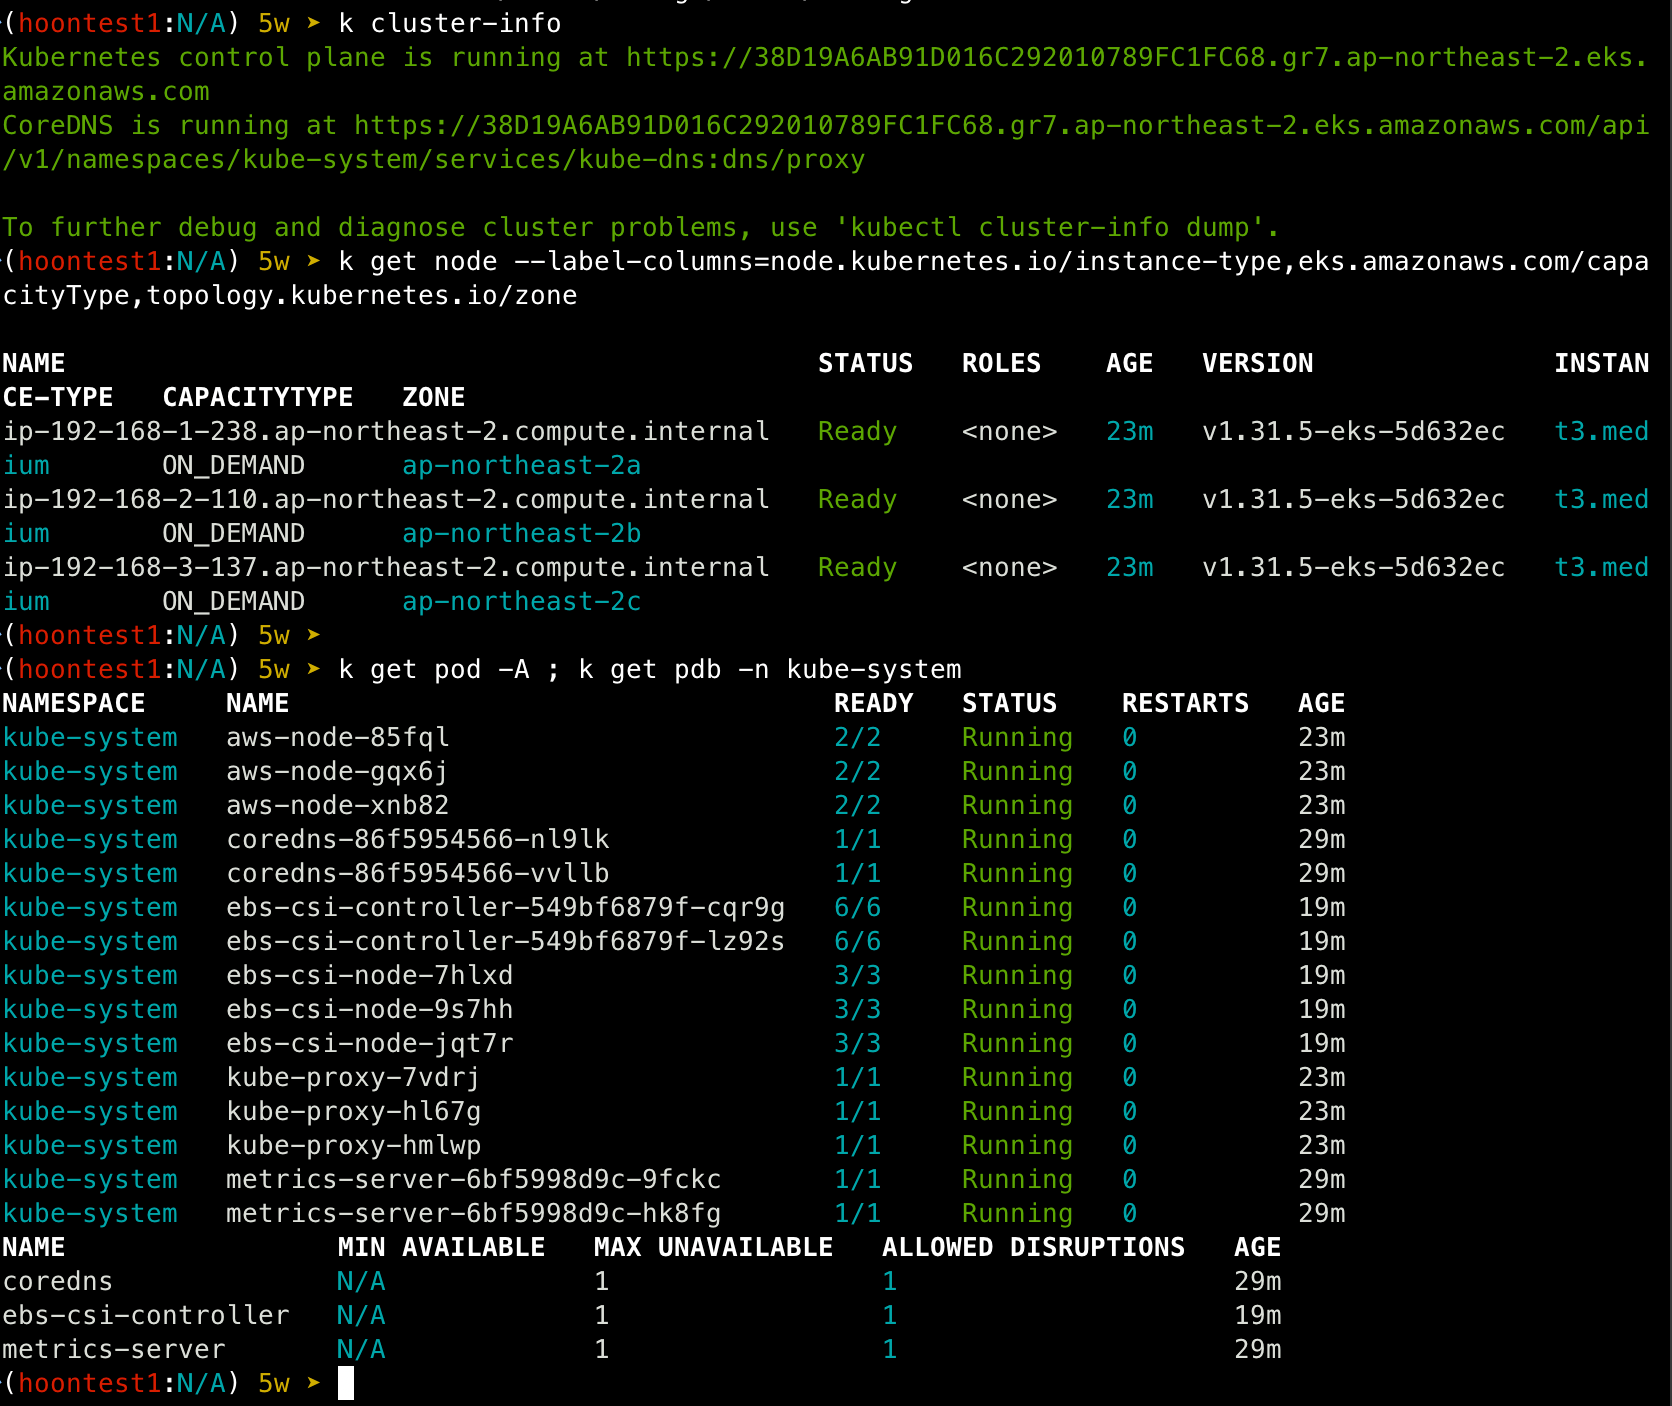
AWS LoadBalancer Controller, ExternalDNS, gp3 storageclass, kube-ops-view 설치
## aws loadbalancercontroller
helm repo add eks https://aws.github.io/eks-charts
helm install aws-load-balancer-controller eks/aws-load-balancer-controller -n kube-system --set clusterName=$CLUSTER_NAME \
 --set serviceAccount.create=false --set serviceAccout.name=aws-load-balancer-controller

## ExternalDNS
echo $MyDomain
curl -s https://raw.githubusercontent.com/gasida/PKOS/main/aews/externaldns.yaml | Mydomain=$MyDomain MyDnzHostedZoneId=$MyDnzHostedZoneId envsubst | kubectl apply -f -

## gp3 Storage Class
cat <<EOF | kubectl apply -f -
kind: StorageClass
apiVersion: storage.k8s.io/v1
metaata:
  name: gp3
  annotations:
    storageclass.kubernetes.io/is-default-class: "true"
allowVolumeExpansion: true
provisioner: ebs.csi.aws.com
volumeBindingMode: WaitForFirstConsumer
parameters:
  type: gp3
  allowAutoIOPSPerGBIncrease: 'true'
  encrypted: 'true'
  fsType: xfs
EOF

k get sc

## kube-ops-view install
helm repo add geek-cookbook https://geek-cookbook.github.io/charts/
helm install kube-ops-view geek-cookbook/kube-ops-view --version 1.2.2 --set service.main.type=ClusterIP  --set env.TZ="Asia/Seoul" --namespace kube-system

# kubeopsview 용 Ingress 설정
echo $CERT_ARN
cat <<EOF | kubectl apply -f -
apiVersion: networking.k8s.io/v1
kind: Ingress
metadata:
  annotations:
    alb.ingress.kubernetes.io/certificate-arn: $CERT_ARN
    alb.ingress.kubernetes.io/group.name: study
    alb.ingress.kubernetes.io/listen-ports: '[{"HTTPS":443}, {"HTTP":80}]'
    alb.ingress.kubernetes.io/load-balancer-name: $CLUSTER_NAME-ingress-alb
    alb.ingress.kubernetes.io/scheme: internet-facing
    alb.ingress.kubernetes.io/ssl-redirect: "443"
    alb.ingress.kubernetes.io/success-codes: 200-399
    alb.ingress.kubernetes.io/target-type: ip
  labels:
    app.kubernetes.io/name: kubeopsview
  name: kubeopsview
  namespace: kube-system
spec:
  ingressClassName: alb
  rules:
  - host: kubeopsview.$MyDomain
    http:
      paths:
      - backend:
          service:
            name: kube-ops-view
            port:
              number: 8080  # name: http
        path: /
        pathType: Prefix
EOF
설치 확인
## pod 내역 확인
k get pods -n kube-system
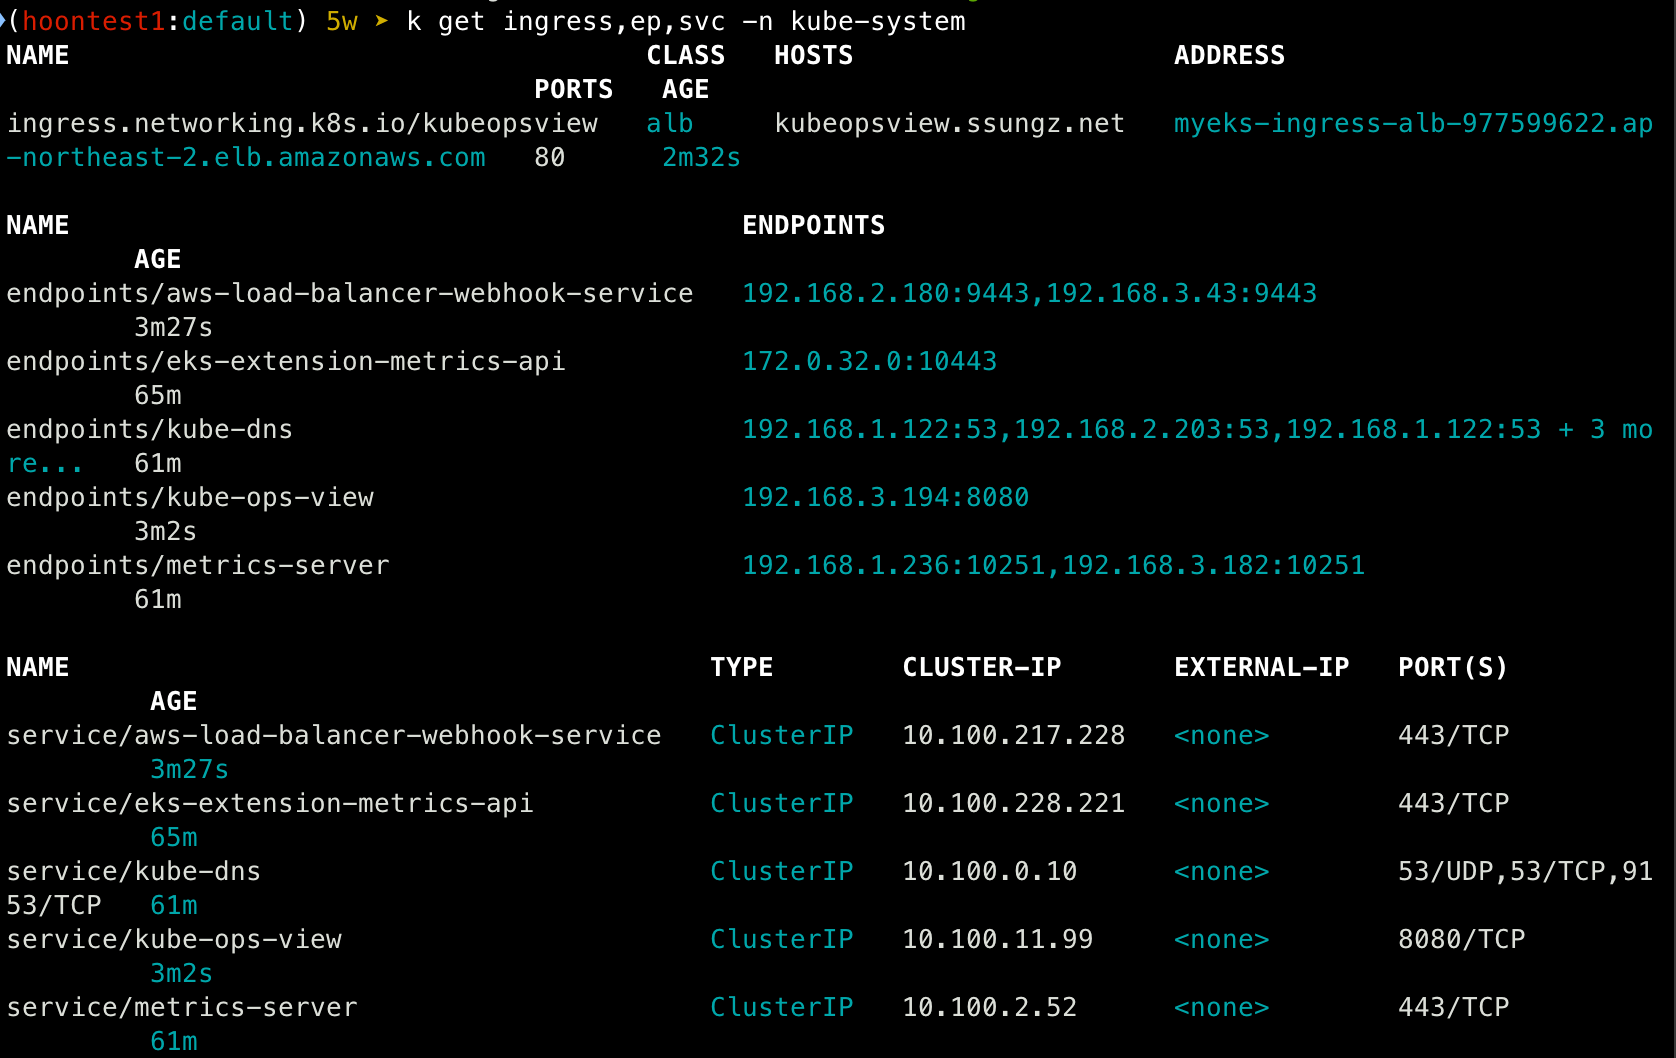
## service, endpoint, ingress 확인
k get ingress,ep,svc -n kube-system
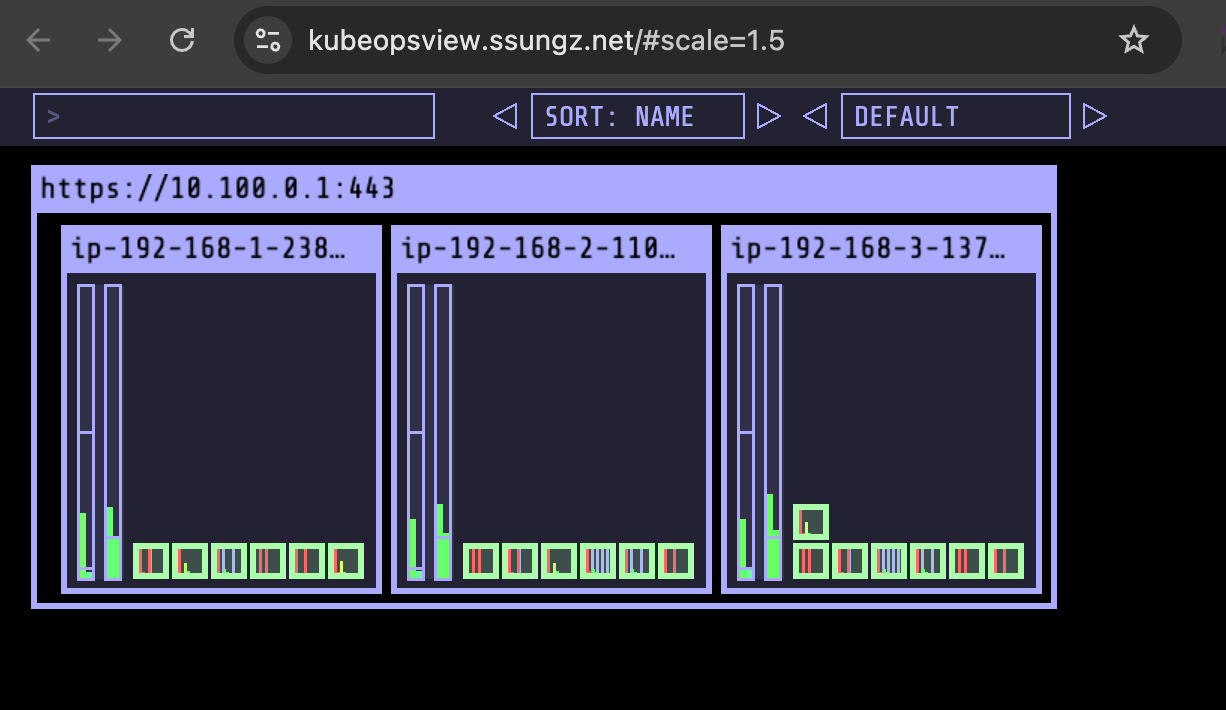
## kube-ops-view 접속 정보 확인
echo -e "Kube ops view URL = https://kubeopsview.$MyDomain/#scale=1.5"
open "https://kubeopsview.$MyDomain/#scale=1.5"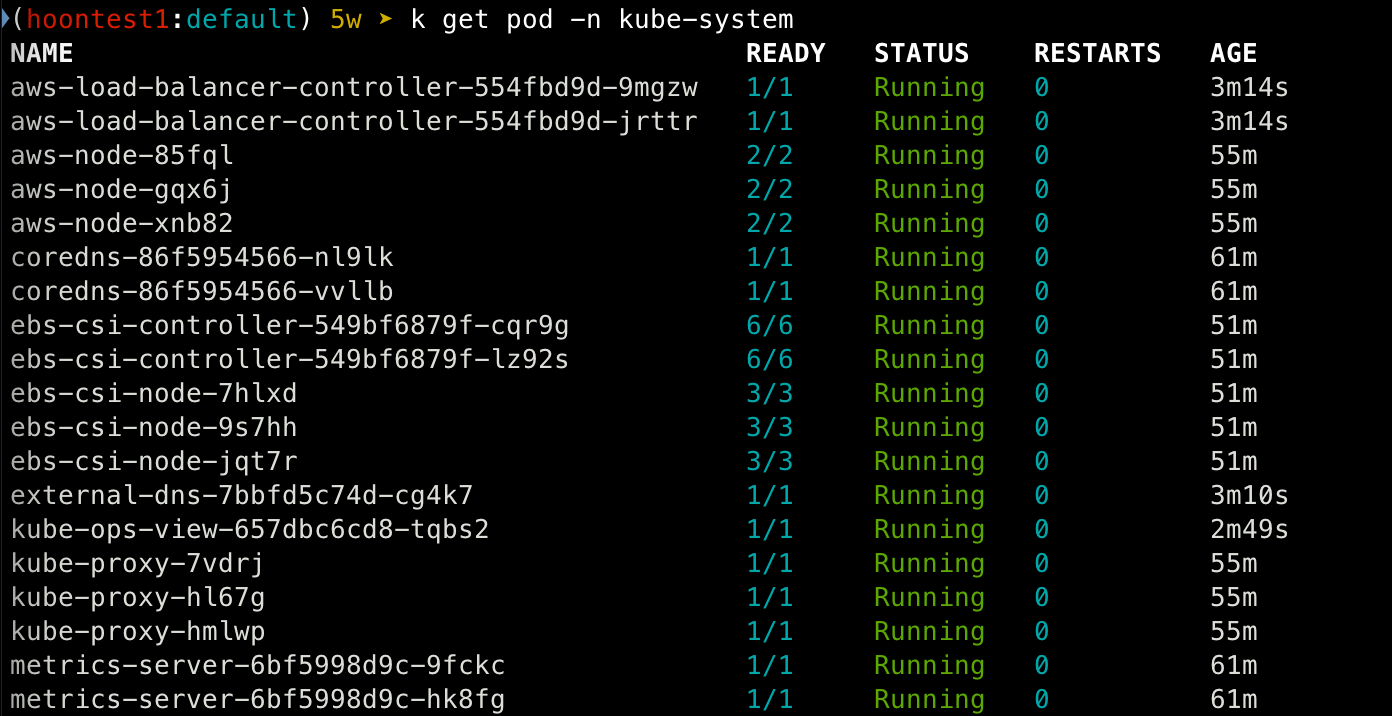
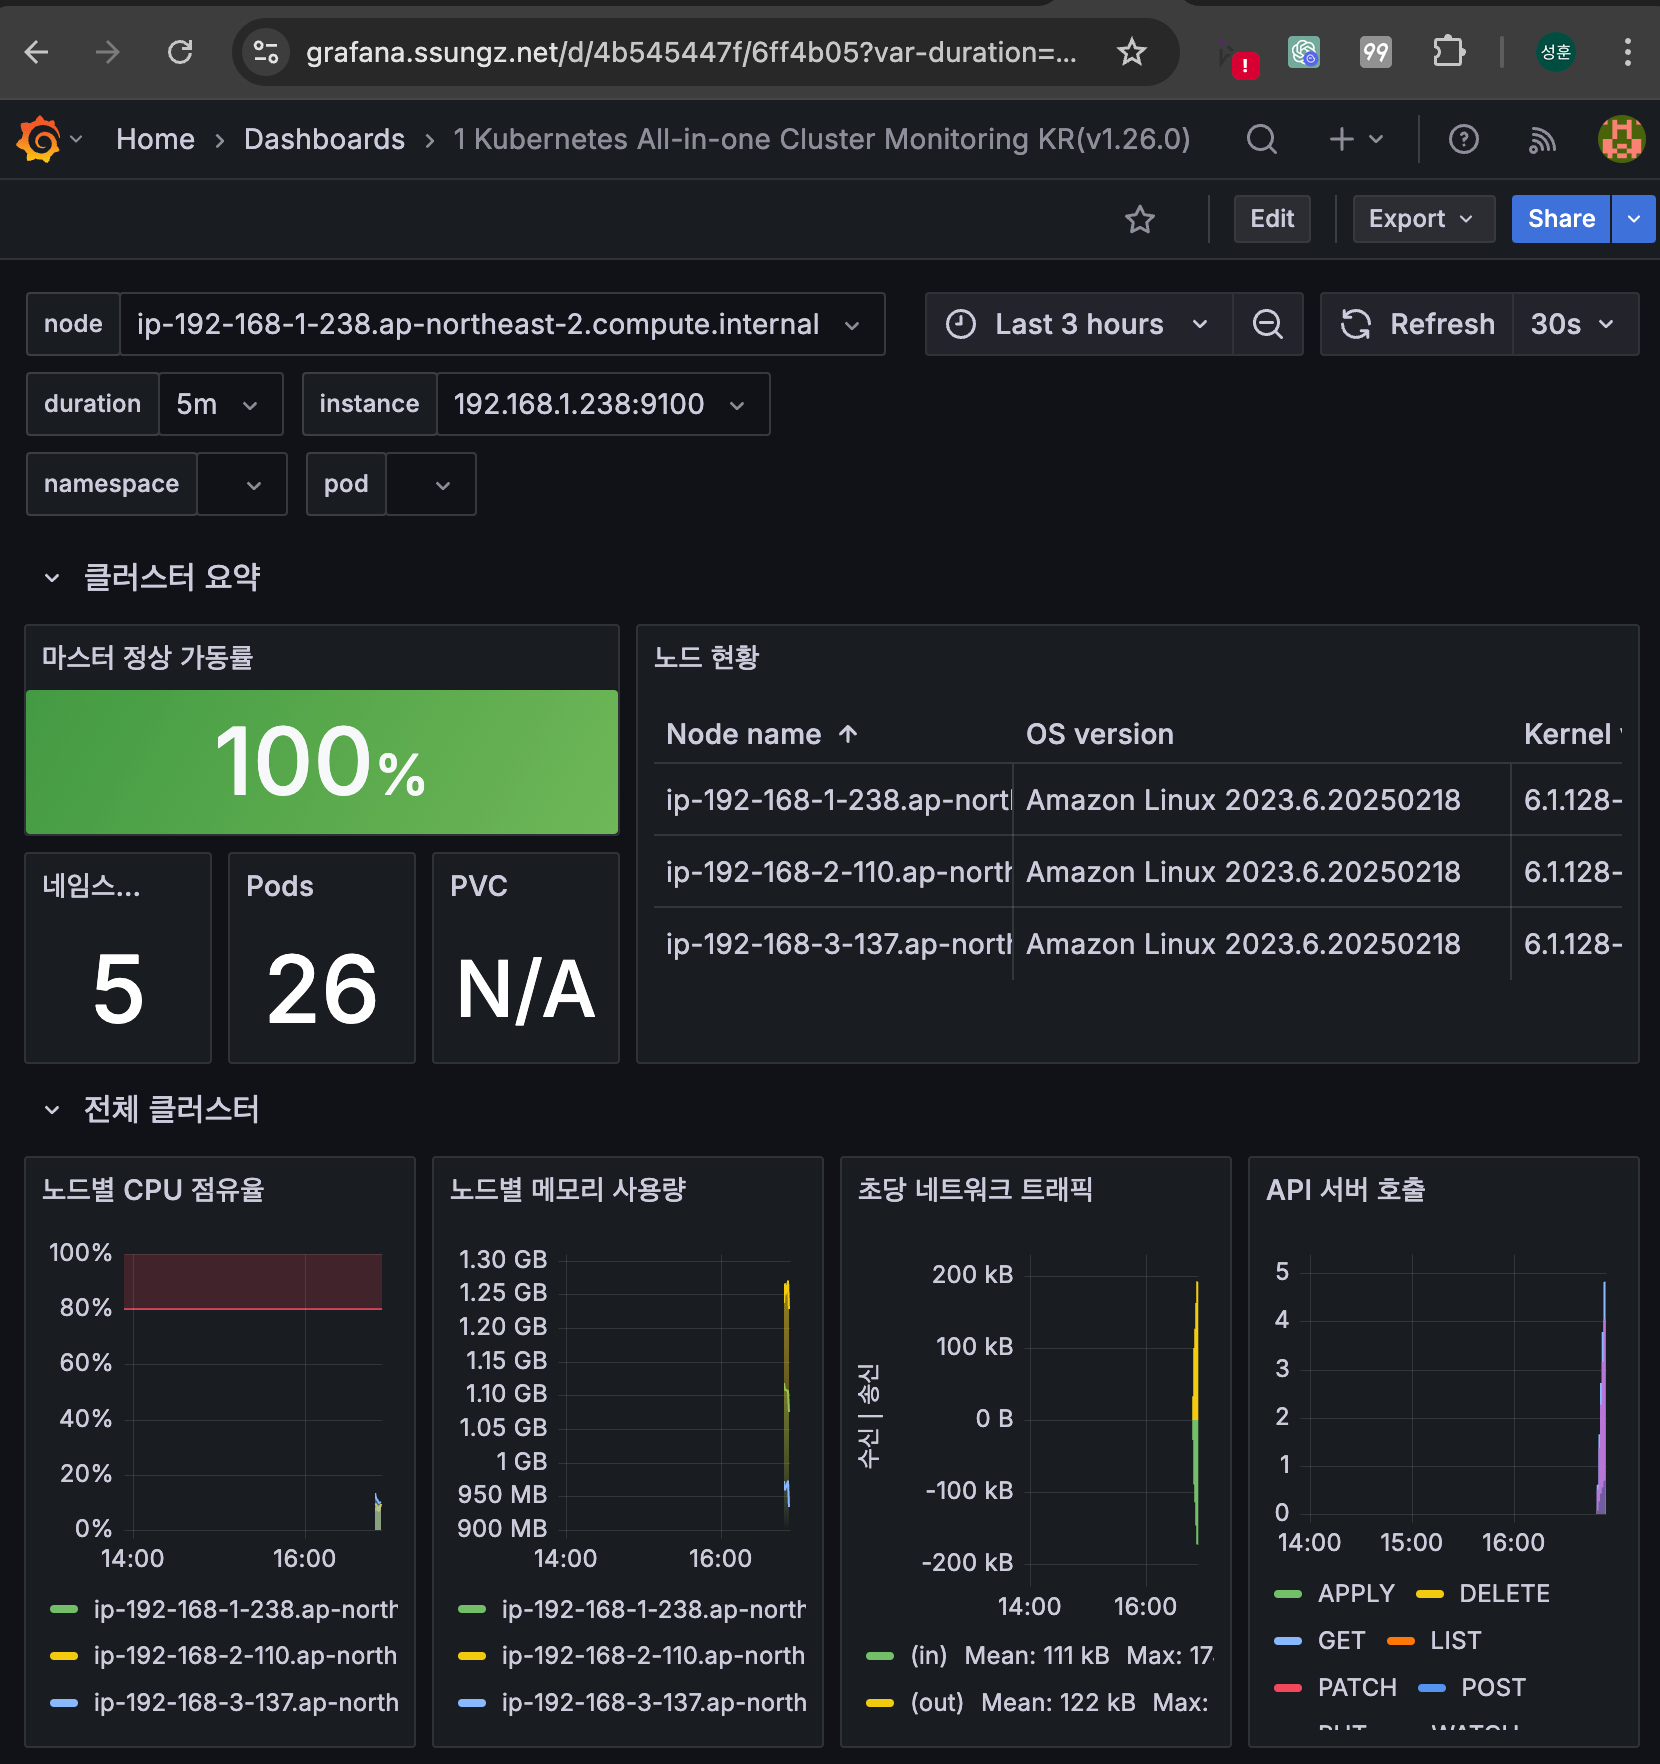
프로메테우스 & 그라파나 설치 : Import Dashboard 17900
## helm repo 추가
helm repo add prometheus-community https://prometheus-community.github.io/helm-charts

## 파라미터 파일 생성 : PV / PVC 제외
cat <<EOT > monitor-values.yaml
prometheus:
  prometheusSpec:
    scrapeInterval: "15s"
    evaluationInterval: "15s"
    podMonitorSelectorNilUsesHelmValues: false
    serviceMonitorSelectorNilUsesHelmValues: false
    retention: 5d
    retentionSize: "10GiB"

  # Enable vertical pod autoscaler support for prometheus-operator
  verticalPodAutoscaler:
    enabled: true

  ingress:
    enabled: true
    ingressClassName: alb
    hosts:
      - prometheus.$MyDomain
    paths:
      - /*
    annotations:
      alb.ingress.kubernetes.io/scheme: internet-facing
      alb.ingress.kubernetes.io/target-type: ip
      alb.ingress.kubernetes.io/listen-ports: '[{"HTTPS":443}, {"HTTP":80}]'
      alb.ingress.kubernetes.io/certificate-arn: $CERT_ARN
      alb.ingress.kubernetes.io/success-codes: 200-399
      alb.ingress.kubernetes.io/load-balancer-name: myeks-ingress-alb
      alb.ingress.kubernetes.io/group.name: study
      alb.ingress.kubernetes.io/ssl-redirect: '443'

grafana:
  defaultDashboardsTimezone: Asia/Seoul
  adminPassword: prom-operator
  defaultDashboardsEnabled: false

  ingress:
    enabled: true
    ingressClassName: alb
    hosts:
      - grafana.$MyDomain
    paths:
      - /*
    annotations:
      alb.ingress.kubernetes.io/scheme: internet-facing
      alb.ingress.kubernetes.io/target-type: ip
      alb.ingress.kubernetes.io/listen-ports: '[{"HTTPS":443}, {"HTTP":80}]'
      alb.ingress.kubernetes.io/certificate-arn: $CERT_ARN
      alb.ingress.kubernetes.io/success-codes: 200-399
      alb.ingress.kubernetes.io/load-balancer-name: myeks-ingress-alb
      alb.ingress.kubernetes.io/group.name: study
      alb.ingress.kubernetes.io/ssl-redirect: '443'

kube-state-metrics:
  rbac:
    extraRules:
      - apiGroups: ["autoscaling.k8s.io"]
        resources: ["verticalpodautoscalers"]
        verbs: ["list", "watch"]
  customResourceState:
    enabled: true
    config:
      kind: CustomResourceStateMetrics
      spec:
        resources:
          - groupVersionKind:
              group: autoscaling.k8s.io
              kind: "VerticalPodAutoscaler"
              version: "v1"
            labelsFromPath:
              verticalpodautoscaler: [metadata, name]
              namespace: [metadata, namespace]
              target_api_version: [apiVersion]
              target_kind: [spec, targetRef, kind]
              target_name: [spec, targetRef, name]
            metrics:
              - name: "vpa_containerrecommendations_target"
                help: "VPA container recommendations for memory."
                each:
                  type: Gauge
                  gauge:
                    path: [status, recommendation, containerRecommendations]
                    valueFrom: [target, memory]
                    labelsFromPath:
                      container: [containerName]
                commonLabels:
                  resource: "memory"
                  unit: "byte"
              - name: "vpa_containerrecommendations_target"
                help: "VPA container recommendations for cpu."
                each:
                  type: Gauge
                  gauge:
                    path: [status, recommendation, containerRecommendations]
                    valueFrom: [target, cpu]
                    labelsFromPath:
                      container: [containerName]
                commonLabels:
                  resource: "cpu"
                  unit: "core"
  selfMonitor:
    enabled: true

alertmanager:
  enabled: false
defaultRules:
  create: false
kubeControllerManager:
  enabled: false
kubeEtcd:
  enabled: false
kubeScheduler:
  enabled: false
prometheus-windows-exporter:
  prometheus:
    monitor:
      enabled: false
EOT
cat monitor-values.yaml

## helm 배포
helm install kube-prometheus-stack prometheus-community/kube-prometheus-stack --version 69.3.1 \
-f monitor-values.yaml --create-namespace --namespace monitoring

## helm 확인
helm get values -n monitoring kube-prometheus-stack

## 프로메테우스 웹 접속
open "https://prometheus.$MyDomain"

## 그라파나 웹 접속
open "https://grafana.$MyDomain"

## Loadbalancer binding 확인
k get targetgroupbindings.elbv2.k8s.aws -A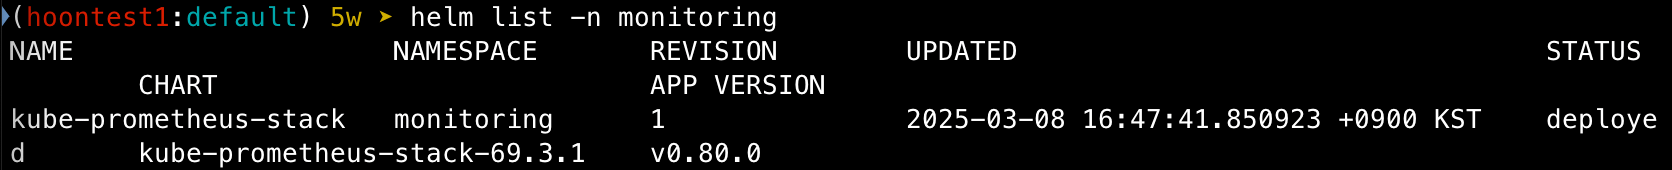
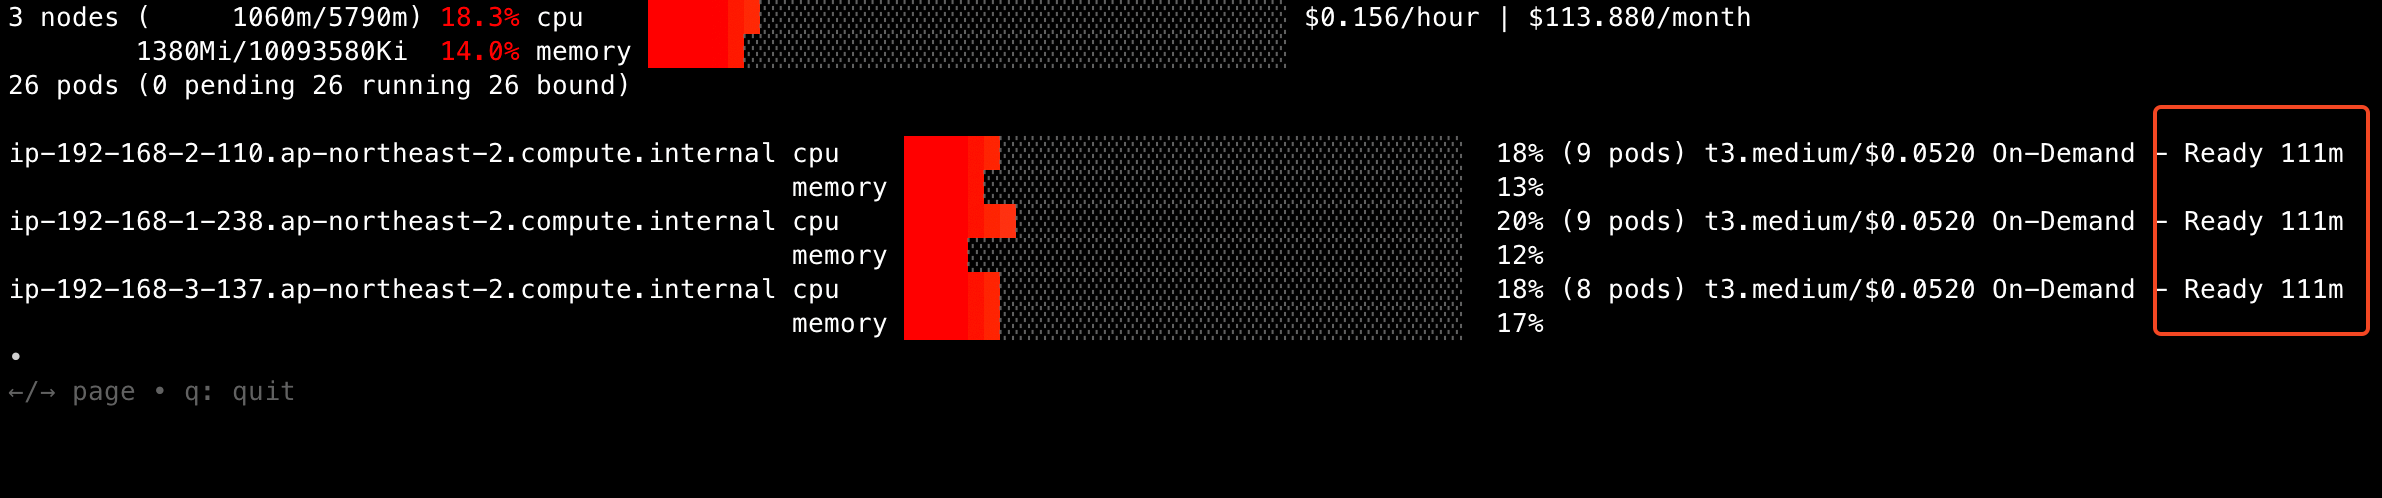
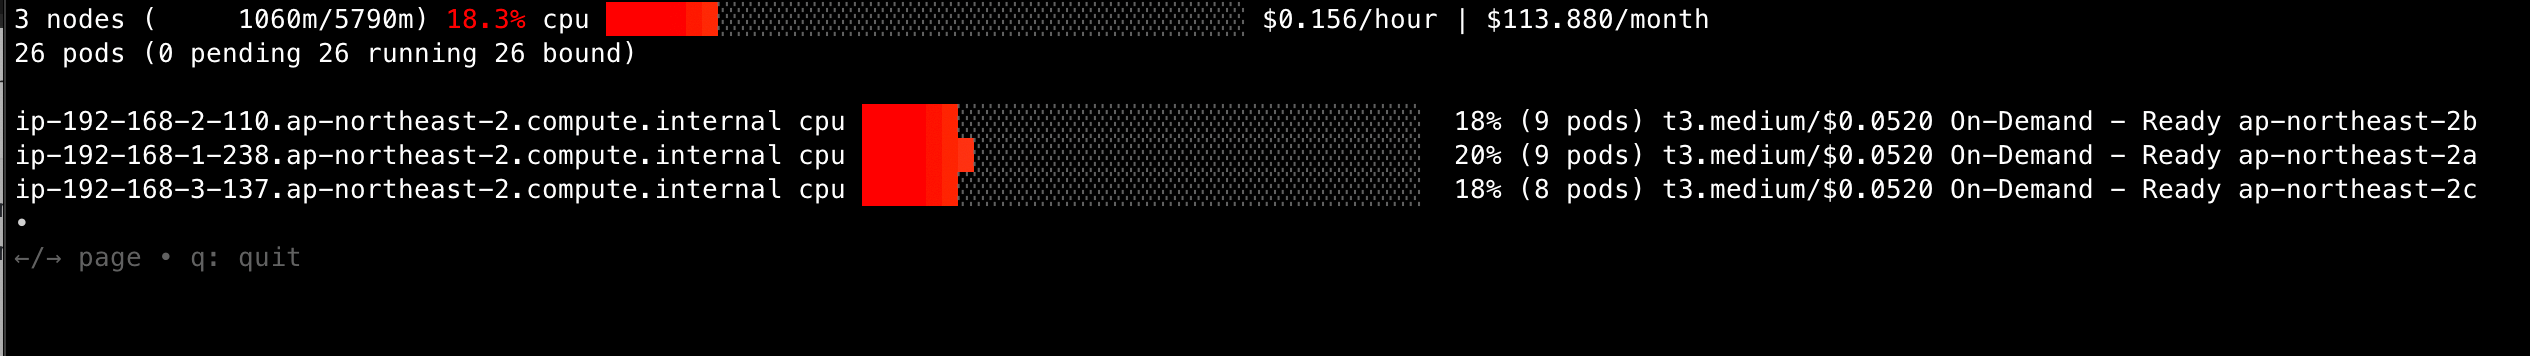
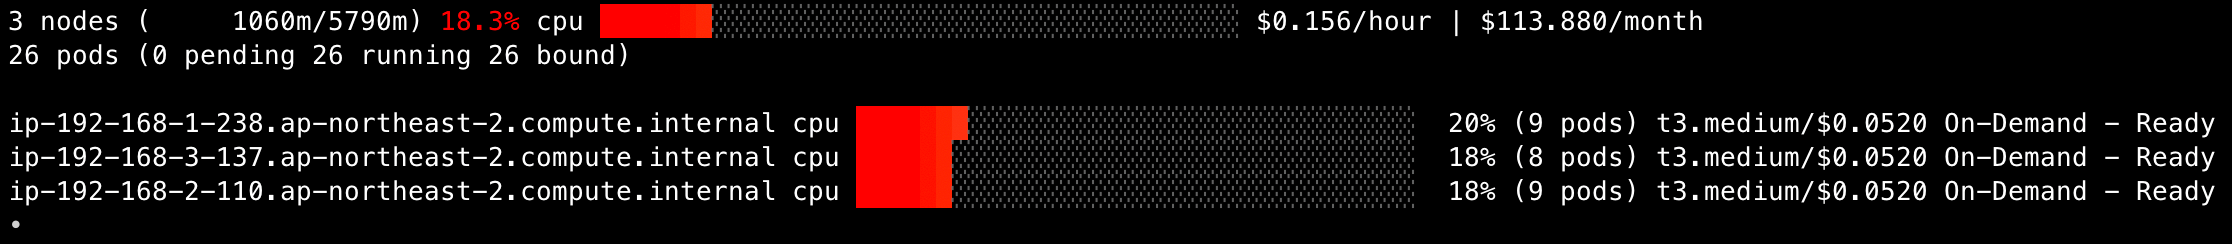
EKS Node Viewer 설치
- 노드 할당 가능 용량과 요청 request 리소스 표시, 실제 파드 사용량은 아님
- Node 마다 할당 가능한 용량과 스케줄링된 Pod의 리소스 중 request 값을 표시한다.
- 실제 Pod 리소스 사용량은 아님
## MAC 설치
brew tap aws tap
brew install eks-node-viewer

## Linux 설치
go install github.com/awslabs/eks-node-viewer/cmd/eks-node-viewer@latest
- 사용
## 기본
eks-node-viewer

## CPU / MEM 표시
eks-node-viewer --resources cpu,memory
eks-node-viewer --resources cpu,memory --extra-labels eks-node-viewer/node-age

## Label로 조회
eks-node-viewer --extra-labels topology.kubernetes.io/zone
eks-node-viewer --extra-labels kubernetes.io/arch

## CPU sort
eks-node-viewer --node-sort=eks-node-viewer/node-vpu-usage-dsc

## karpenter node만
eks-node-viewer --node-selector "karpenter.sh/provisioner-name"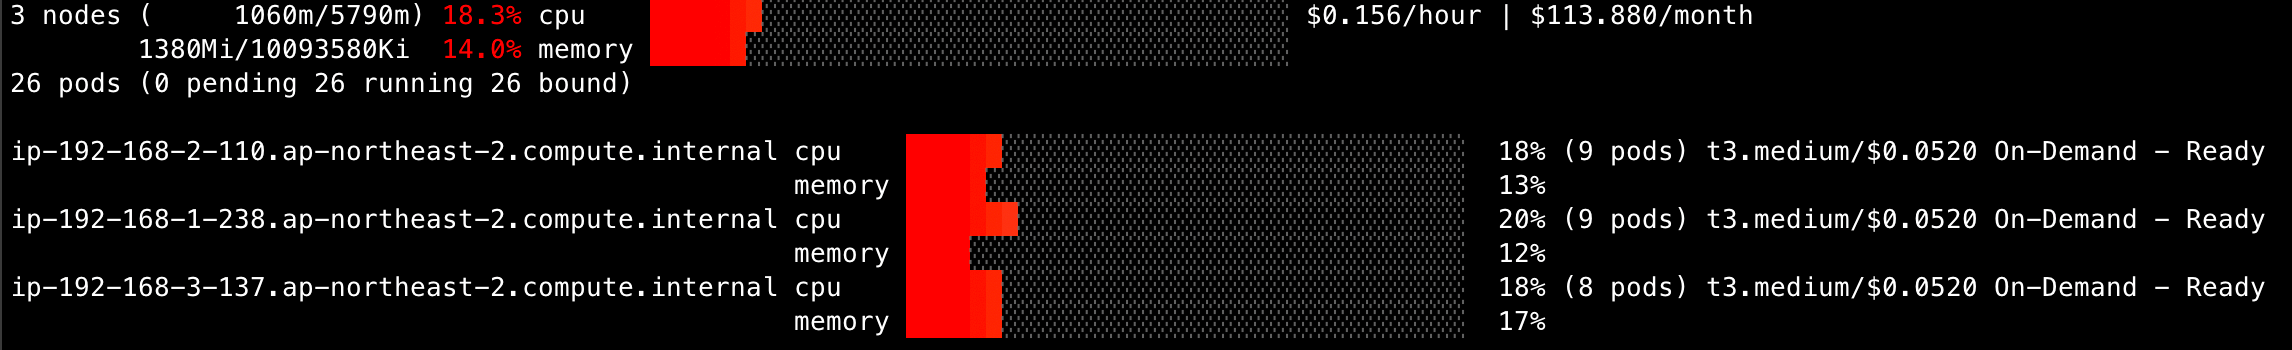
HPA - Horizontal Pod Autoscaler
- 그라파나(22128,22251) 대시보드 import
- hpa-example (CPU 과부하 연산 수행)
# Run and expose php-apache server
cat << EOF > php-apache.yaml
apiVersion: apps/v1
kind: Deployment
metadata:
name: php-apache
spec:
selector:
matchLabels:
run: php-apache
template:
metadata:
labels:
run: php-apache
spec:
containers:
- name: php-apache
image: registry.k8s.io/hpa-example
ports:
- containerPort: 80
resources:
limits:
cpu: 500m
requests:
cpu: 200m
---
apiVersion: v1
kind: Service
metadata:
name: php-apache
labels:
run: php-apache
spec:
ports:
- port: 80
selector:
run: php-apache
EOF
kubectl apply -f php-apache.yaml
# 확인
kubectl exec -it deploy/php-apache -- cat /var/www/html/index.php
...
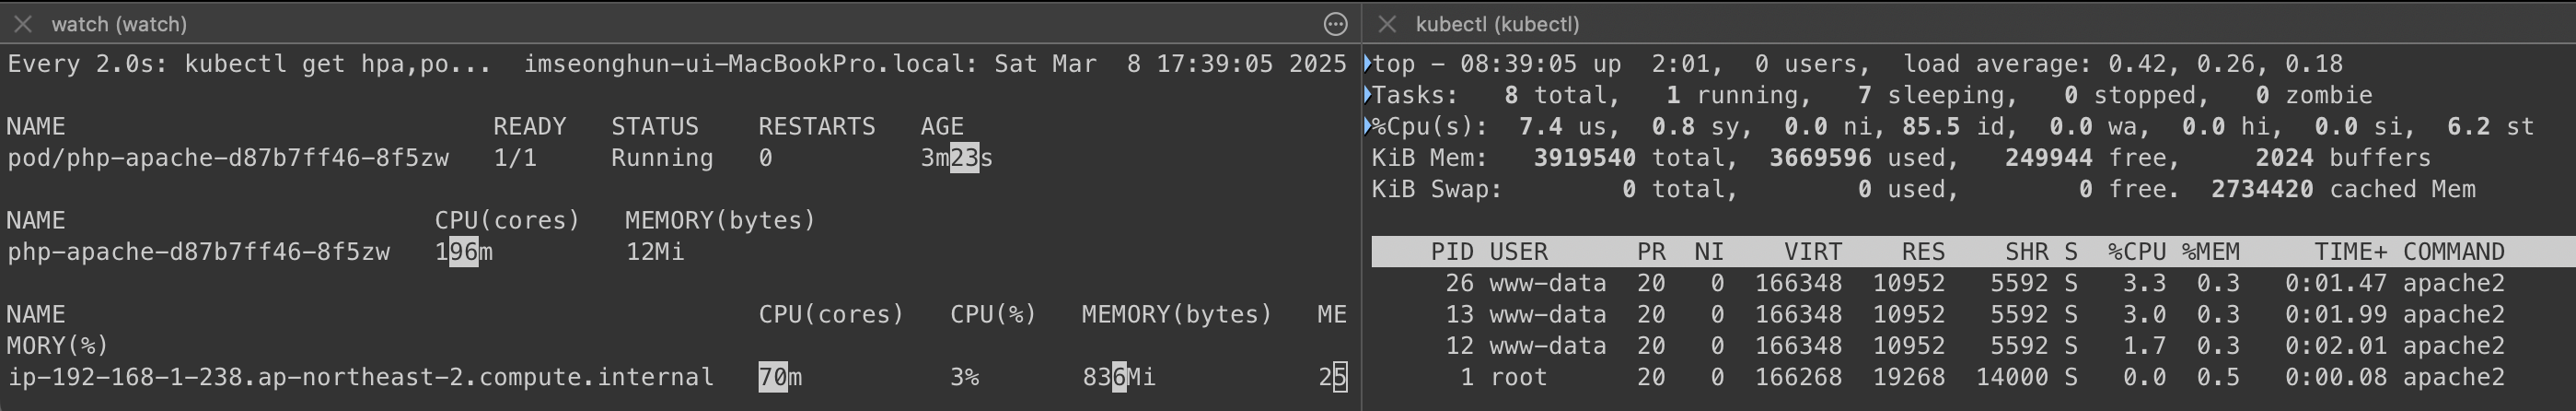
# 모니터링 : 터미널2개 사용
watch -d 'kubectl get hpa,pod;echo;kubectl top pod;echo;kubectl top node'
kubectl exec -it deploy/php-apache -- top
# [운영서버 EC2] 파드IP로 직접 접속
PODIP=$(kubectl get pod -l run=php-apache -o jsonpath="{.items[0].status.podIP}")
curl -s $PODIP; echo
- 부하 발생 확인
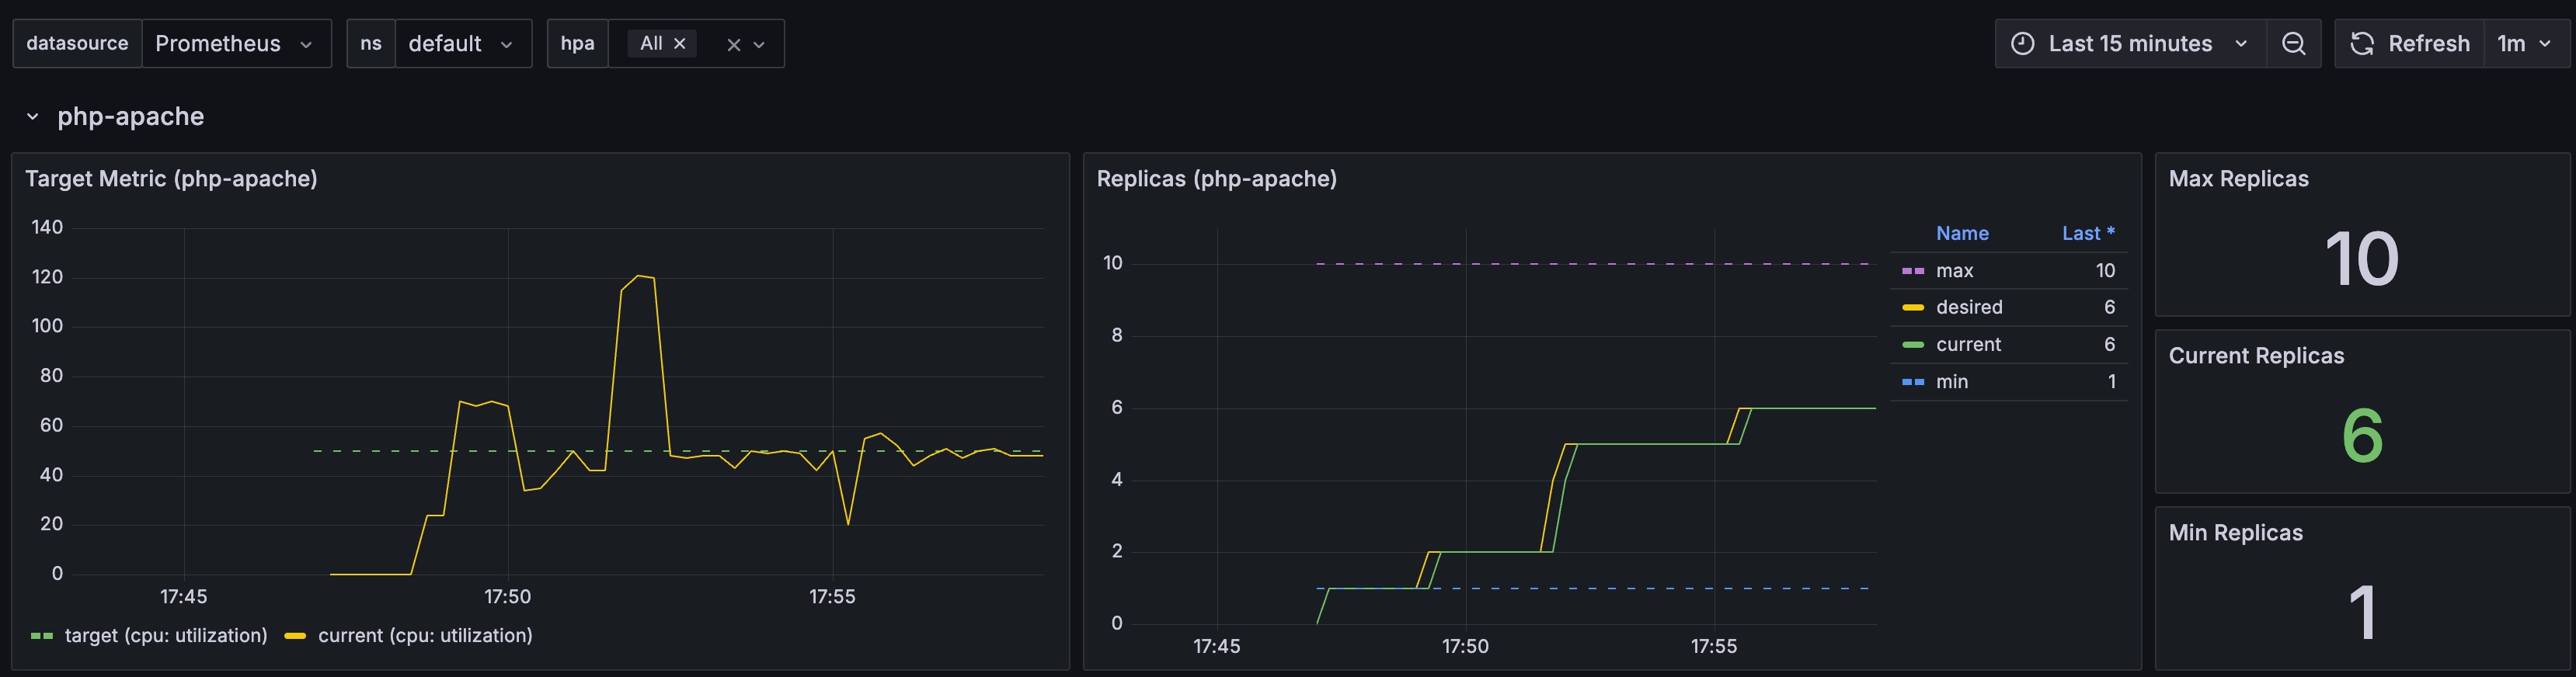
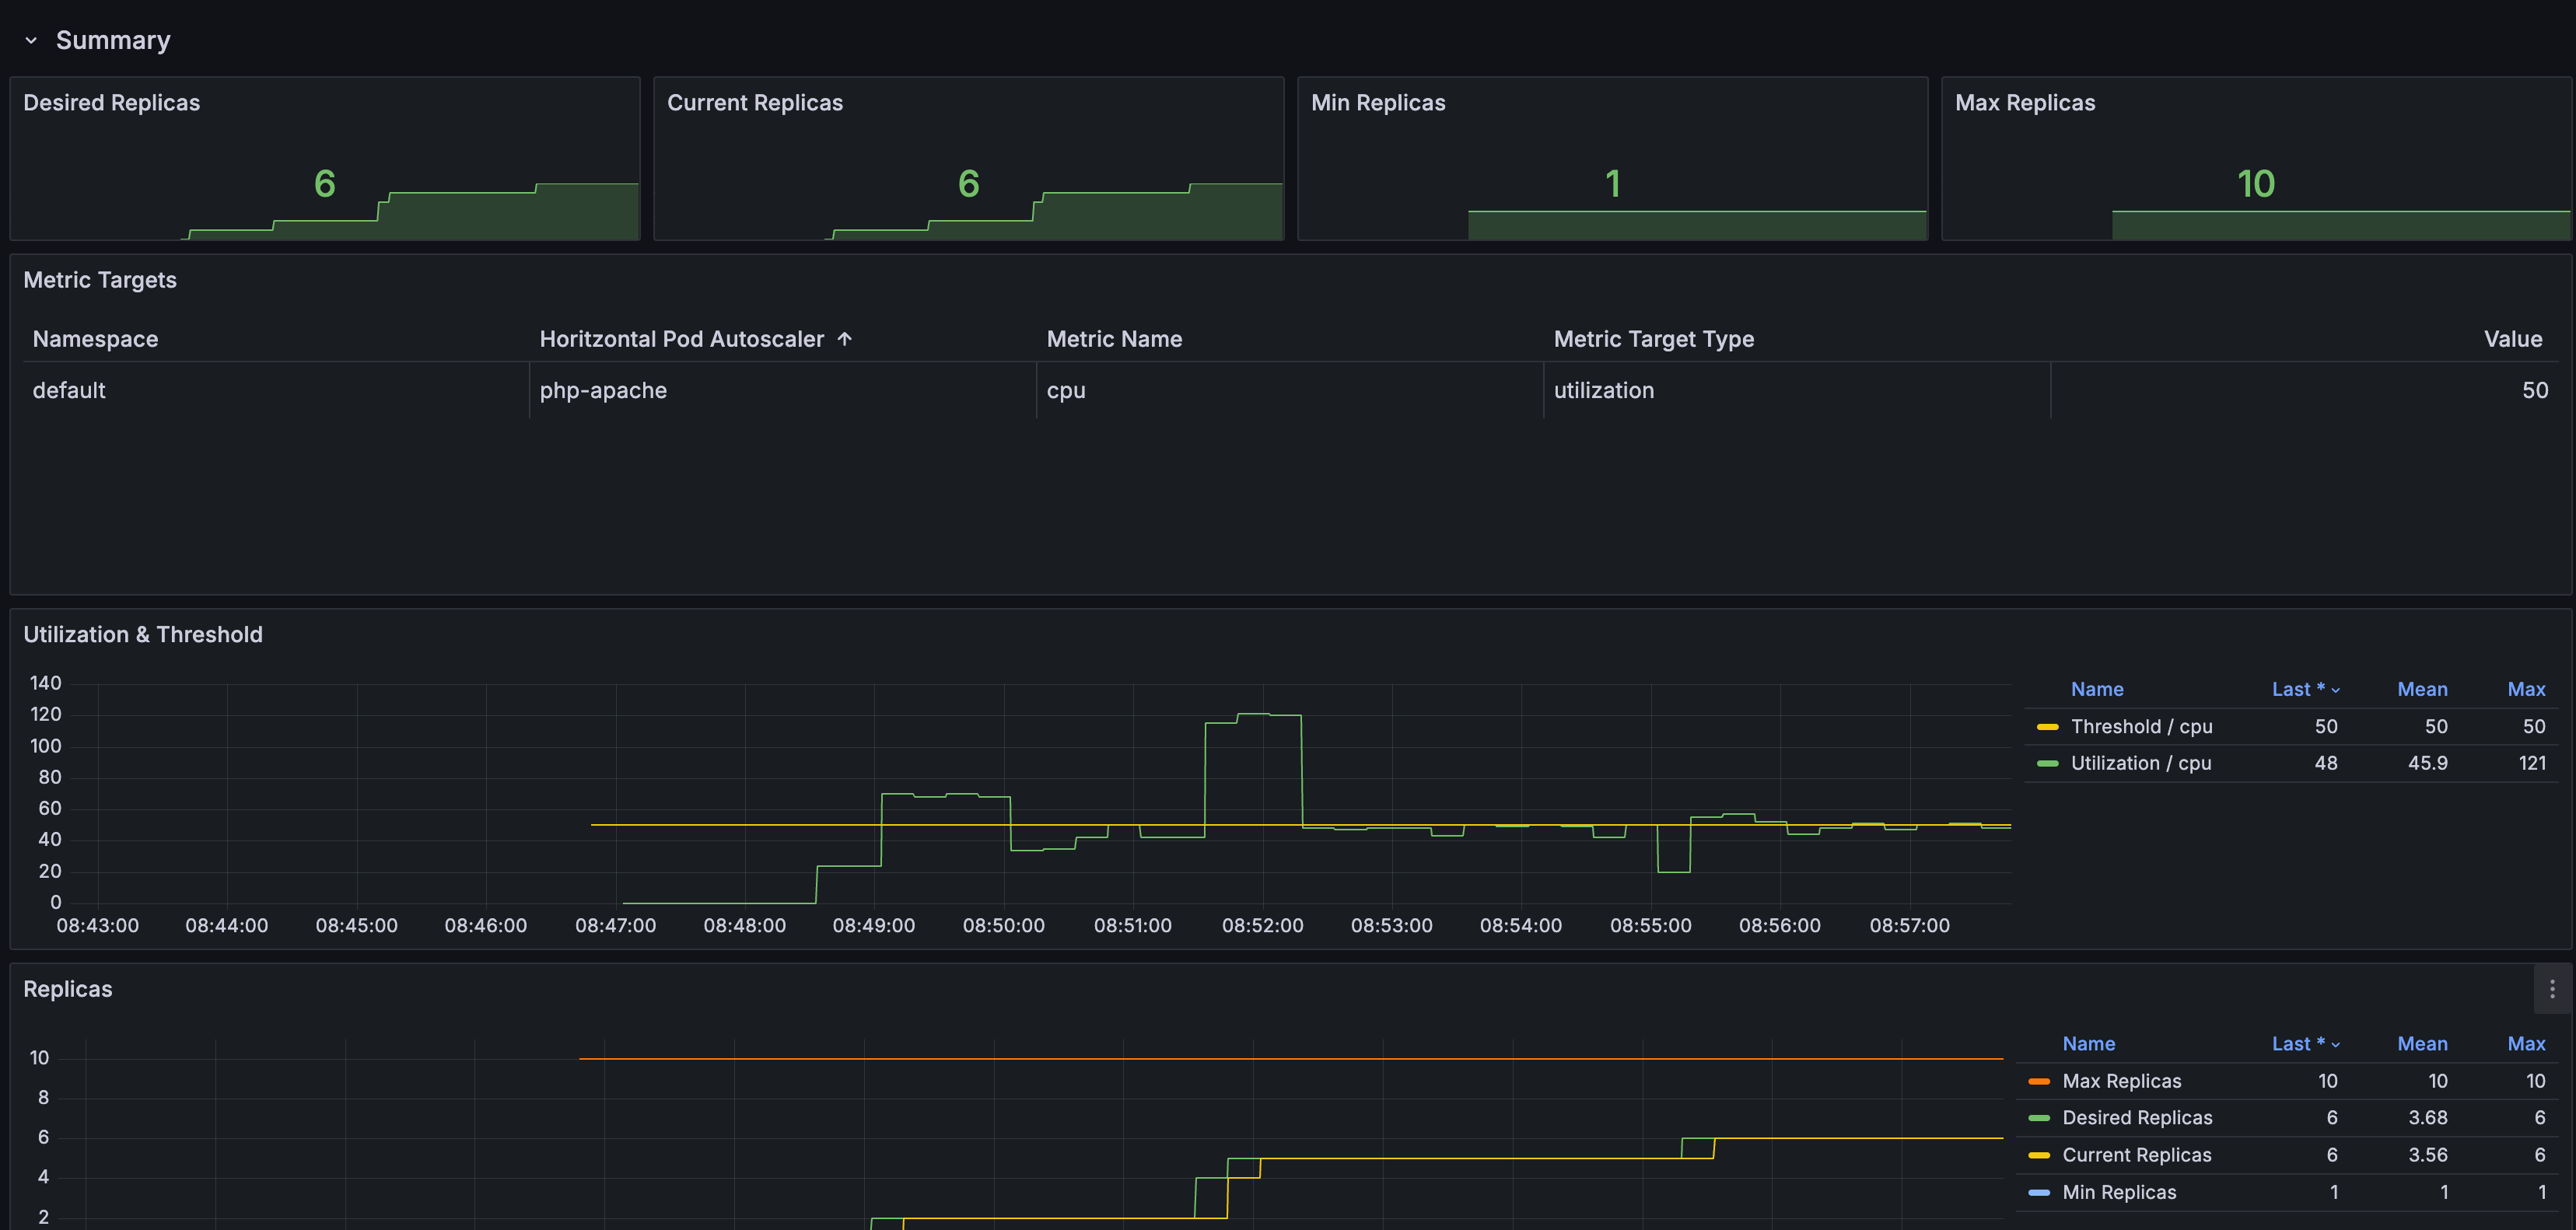
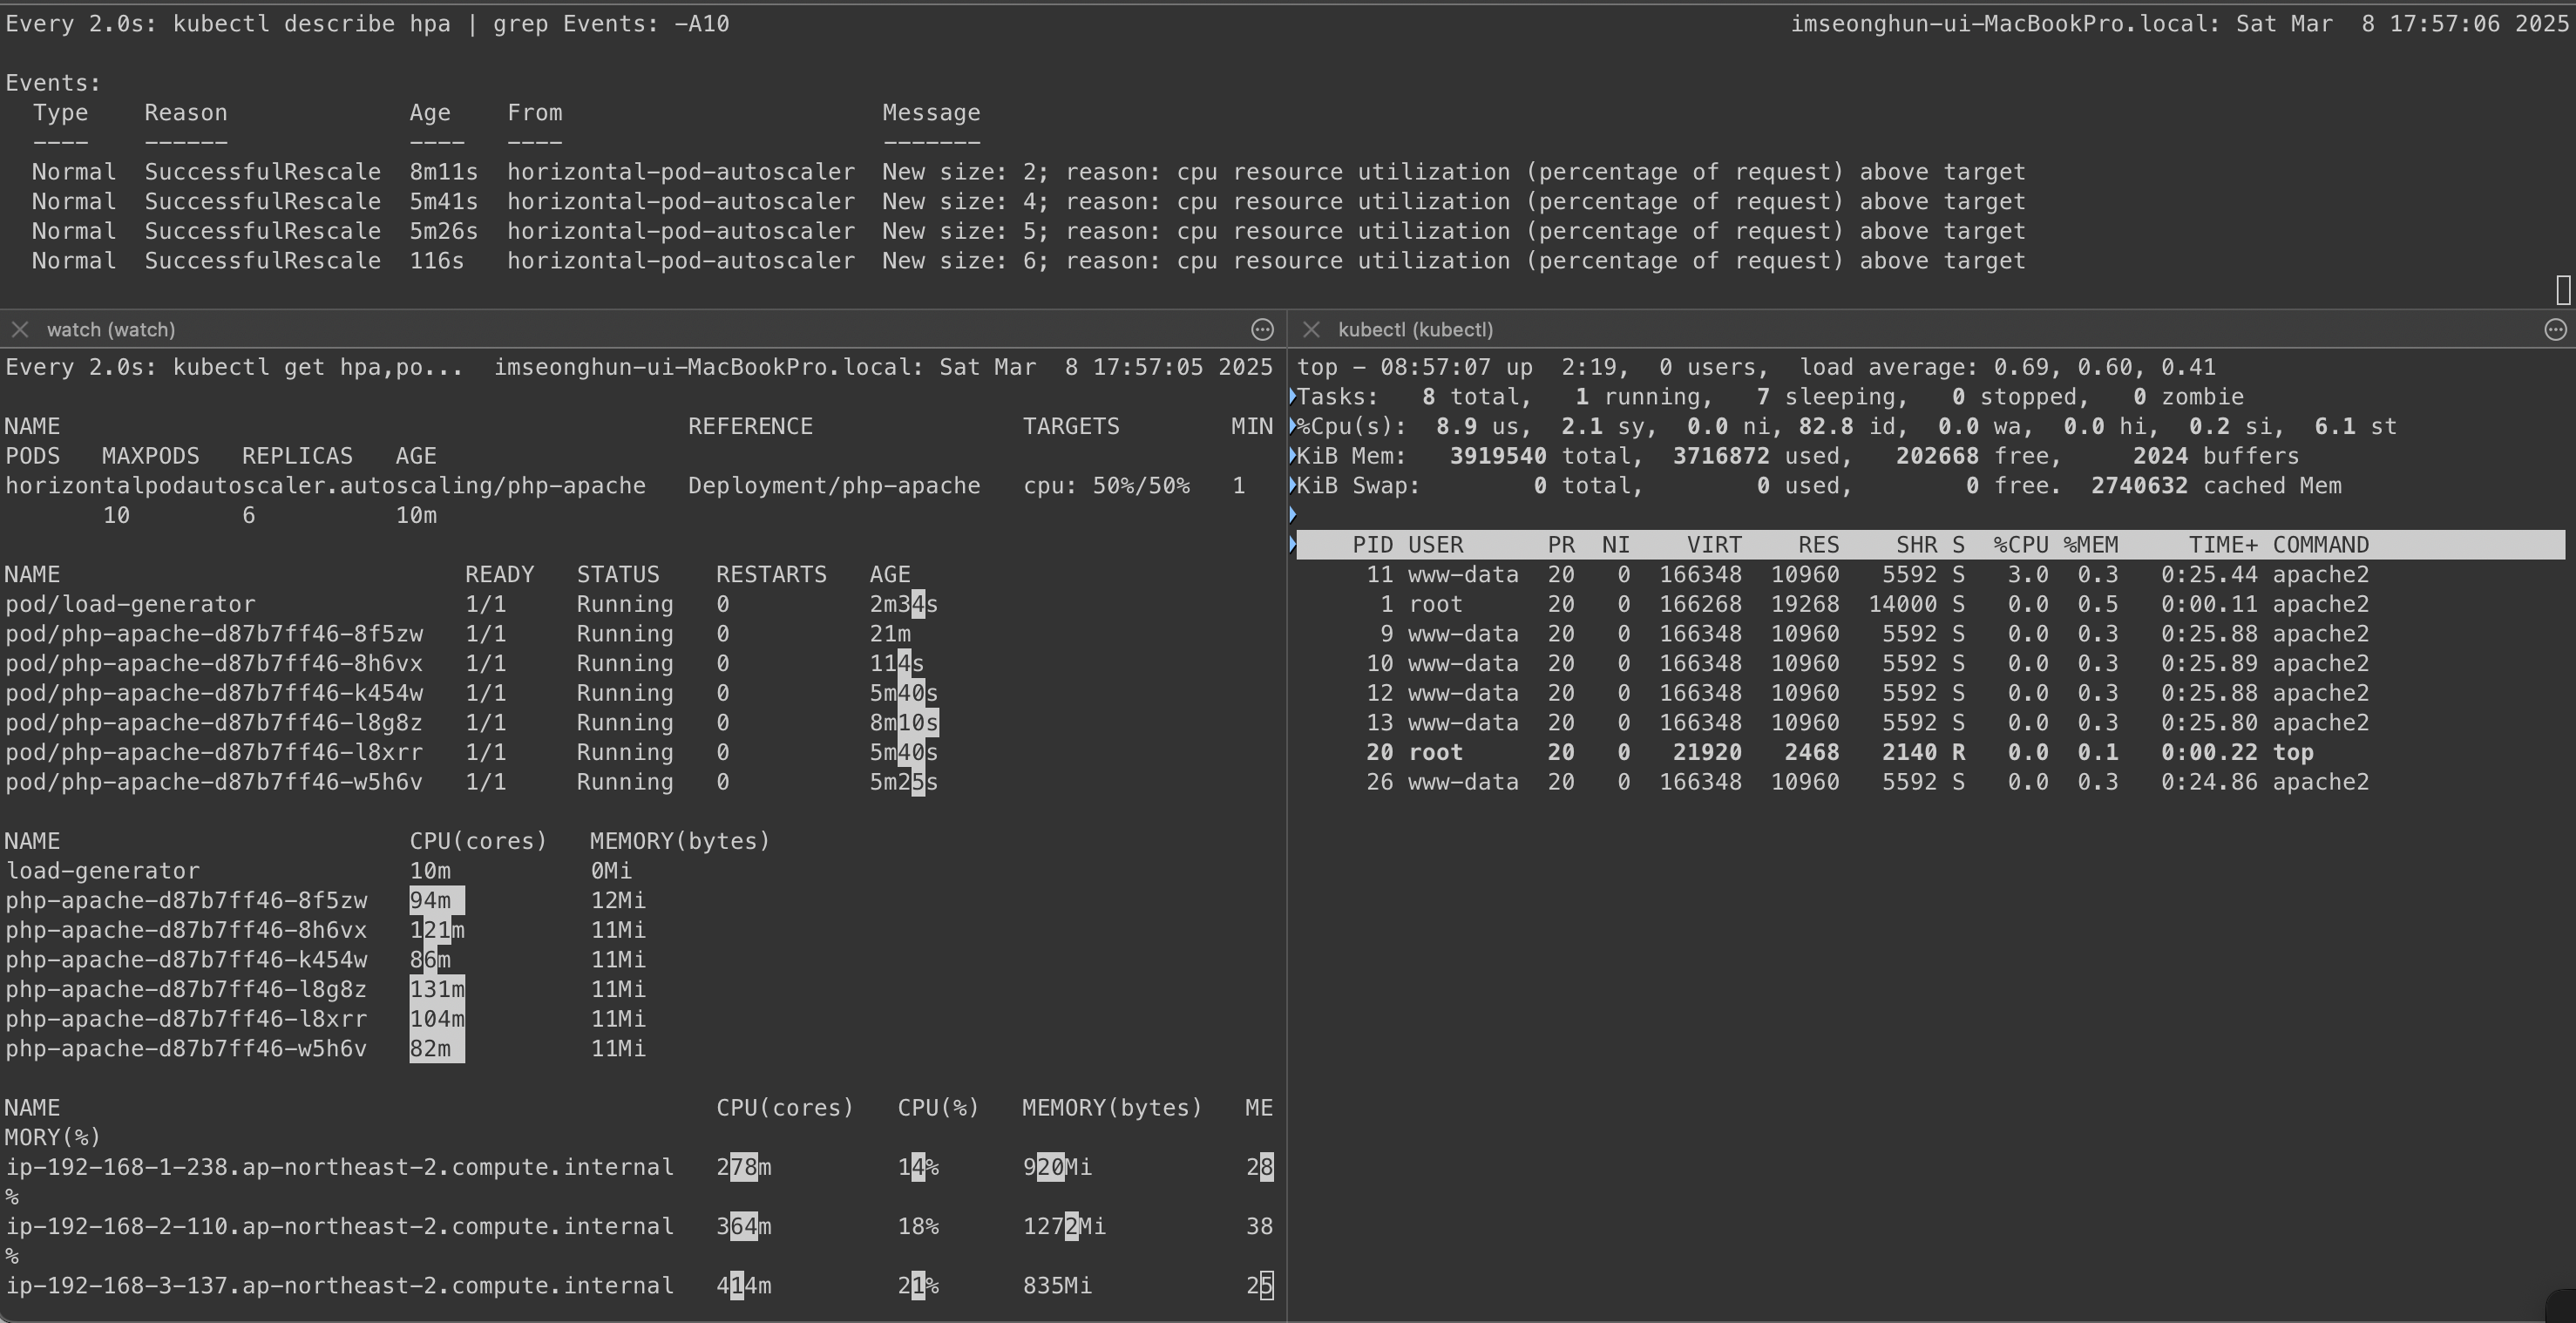
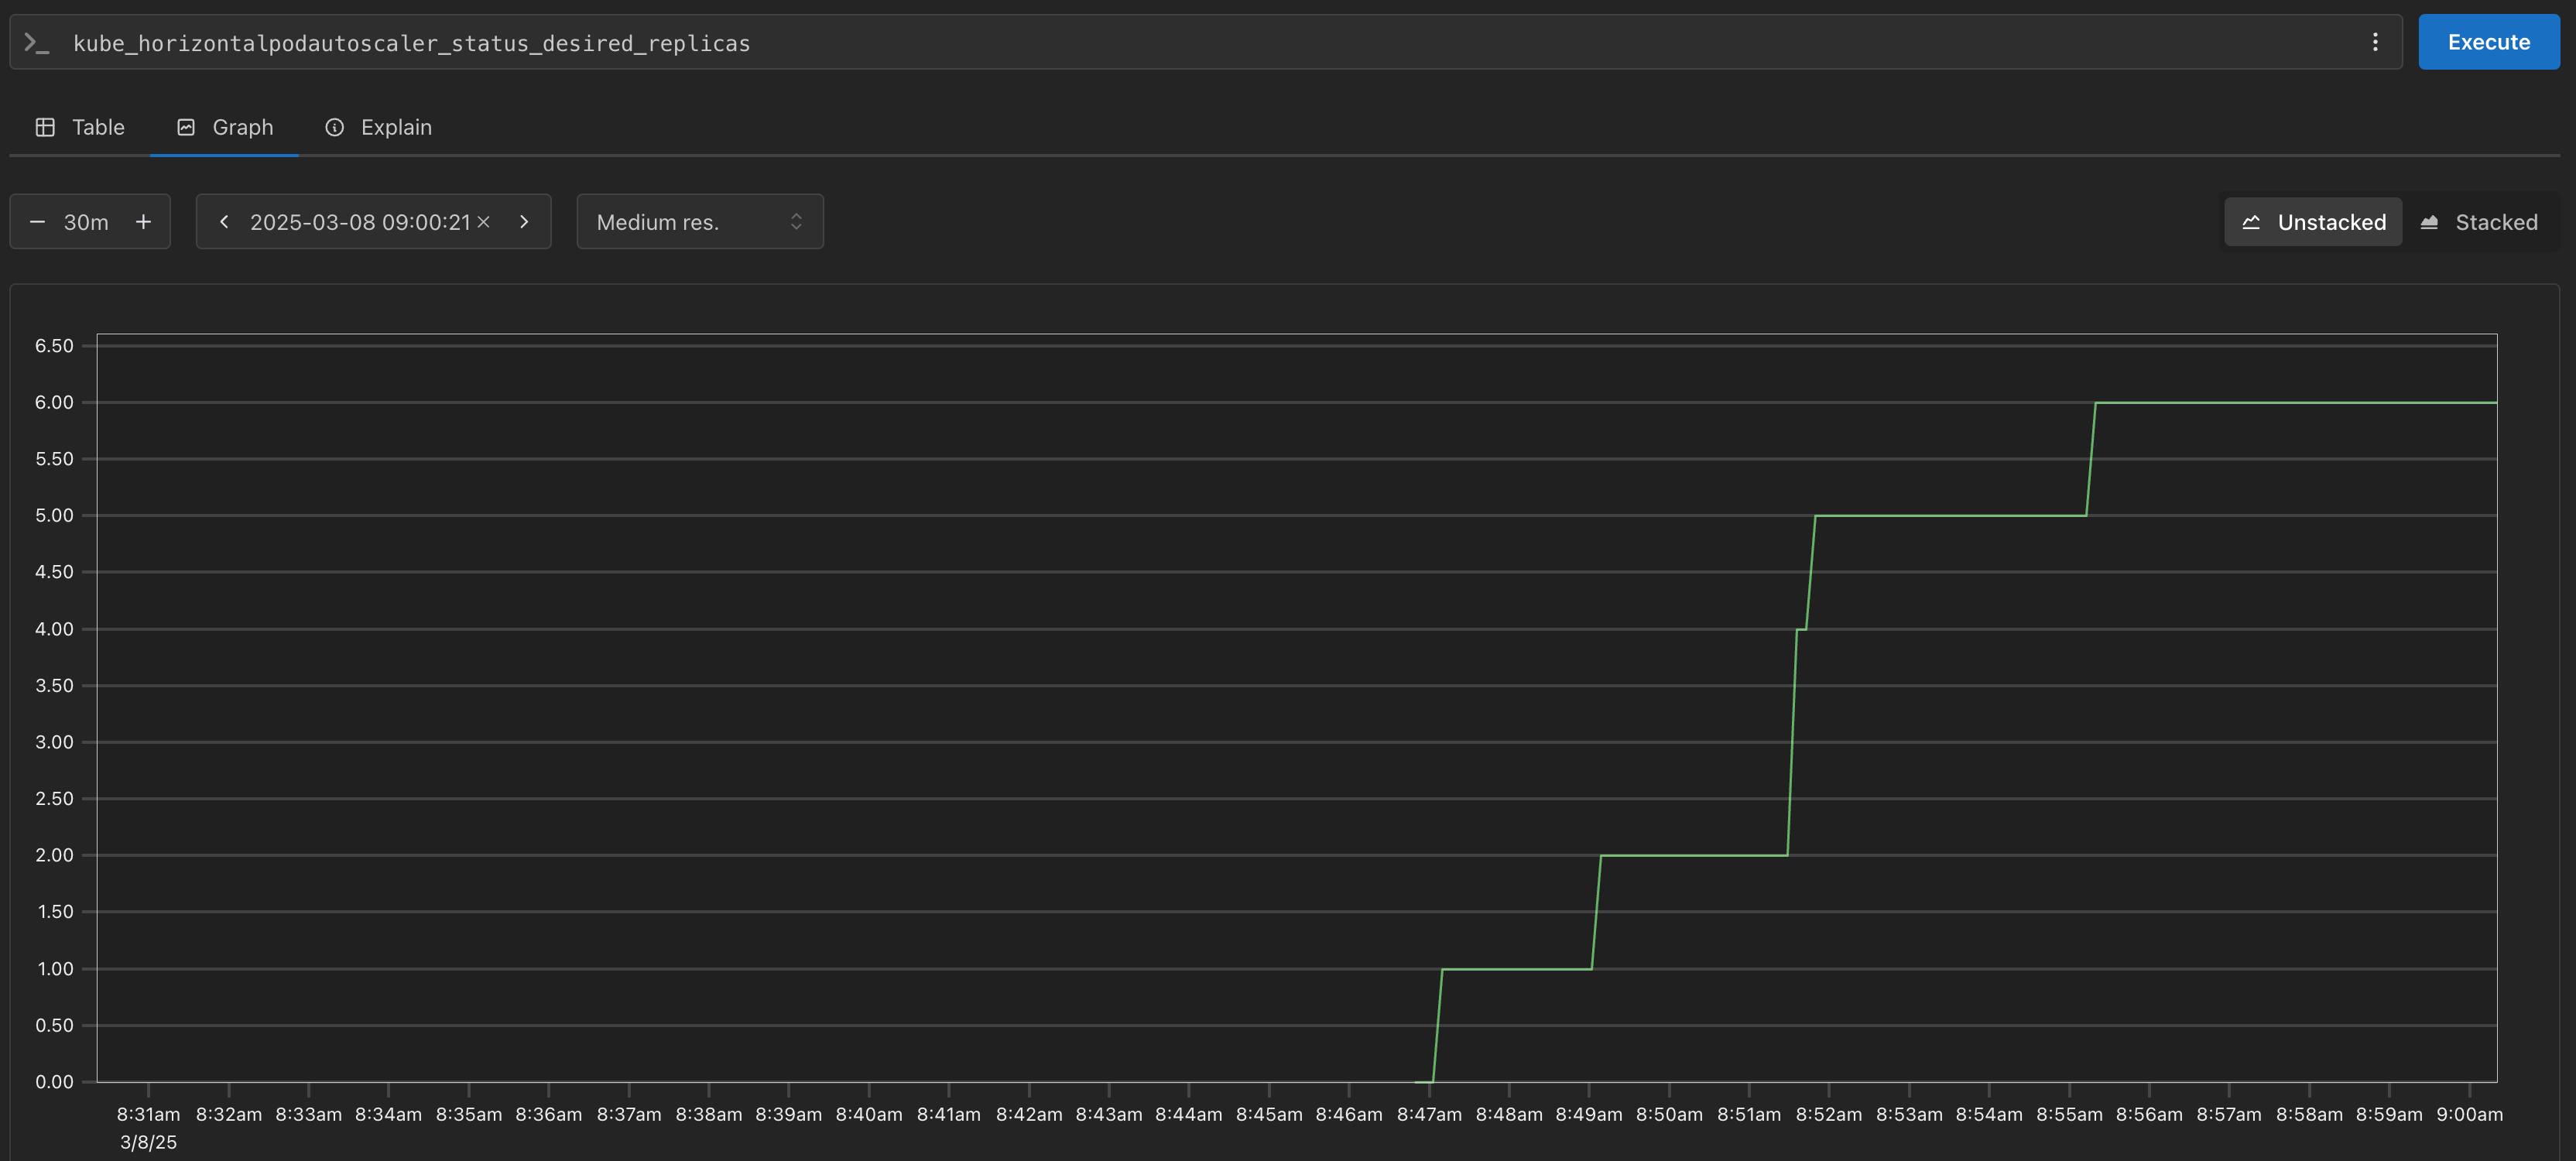
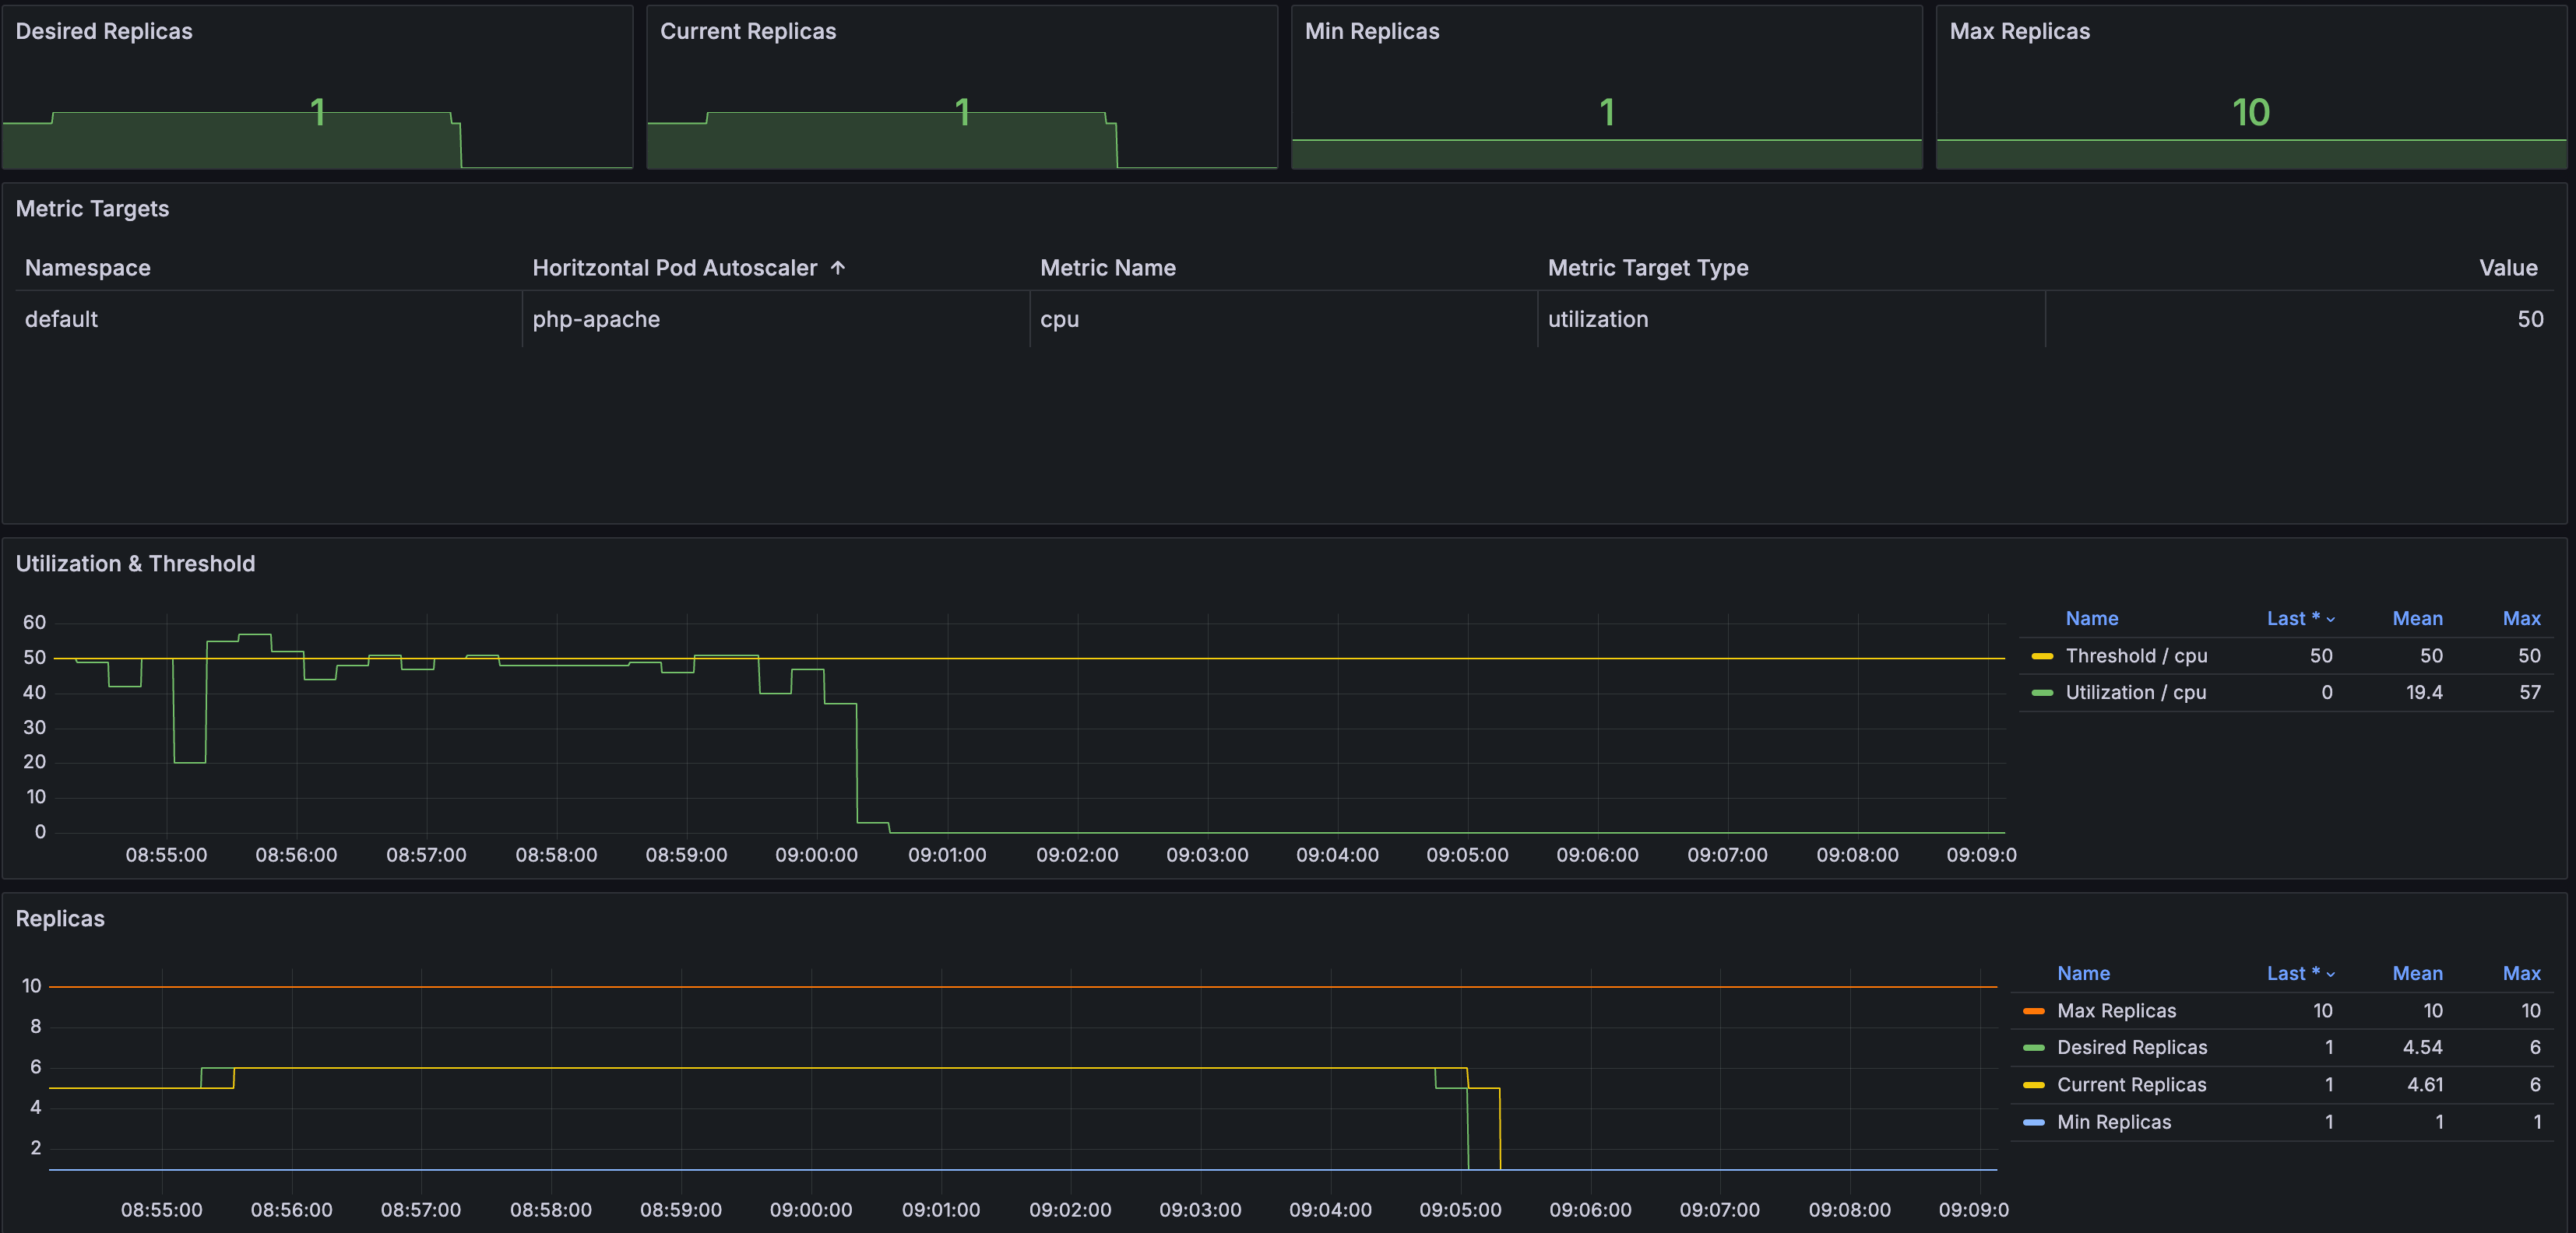
HPA 정책 생성 후 오토 스케일링 테스트
- 증가 시 기본 대기 시간 (30초), 감소 시 기본 대기 시간 (5분)
cat <<EOF | kubectl apply -f -
apiVersion: autoscaling/v2
kind: HorizontalPodAutoscaler
metadata:
name: php-apache
spec:
scaleTargetRef:
apiVersion: apps/v1
kind: Deployment
name: php-apache
minReplicas: 1
maxReplicas: 10
metrics:
- type: Resource
resource:
name: cpu
target:
averageUtilization: 50
type: Utilization
EOF
## 확인
k describe hpa
## HPA 설정 확인
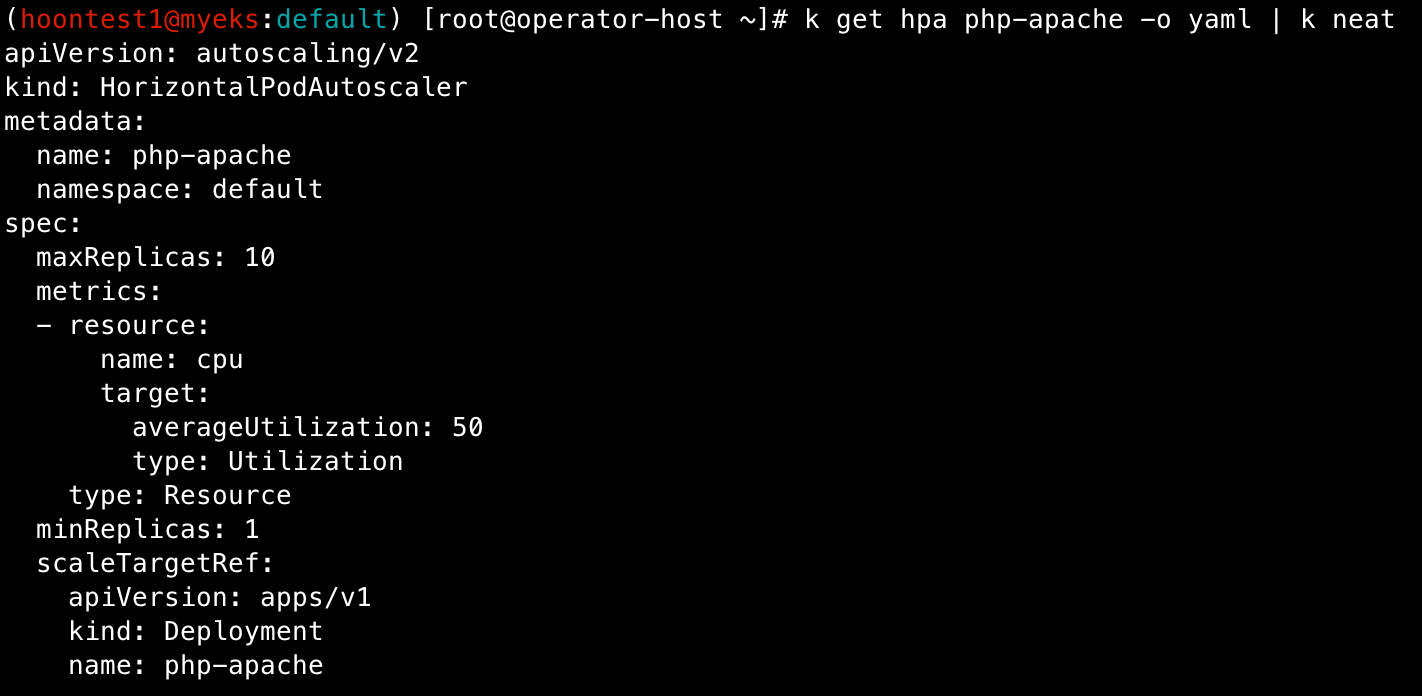
k get hpa php-apache -o yaml | k neat
## 반복 접속 1 [운영 EC2]
while true; do curl -s $PODIP; sleep 0.5; done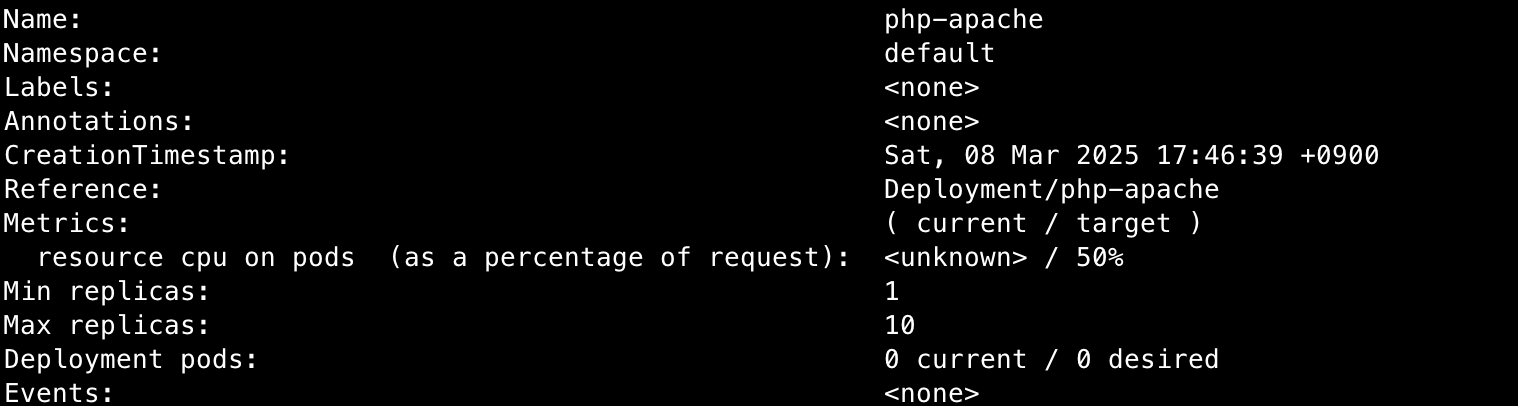
- 부하 발생 시 Pod 생성 확인
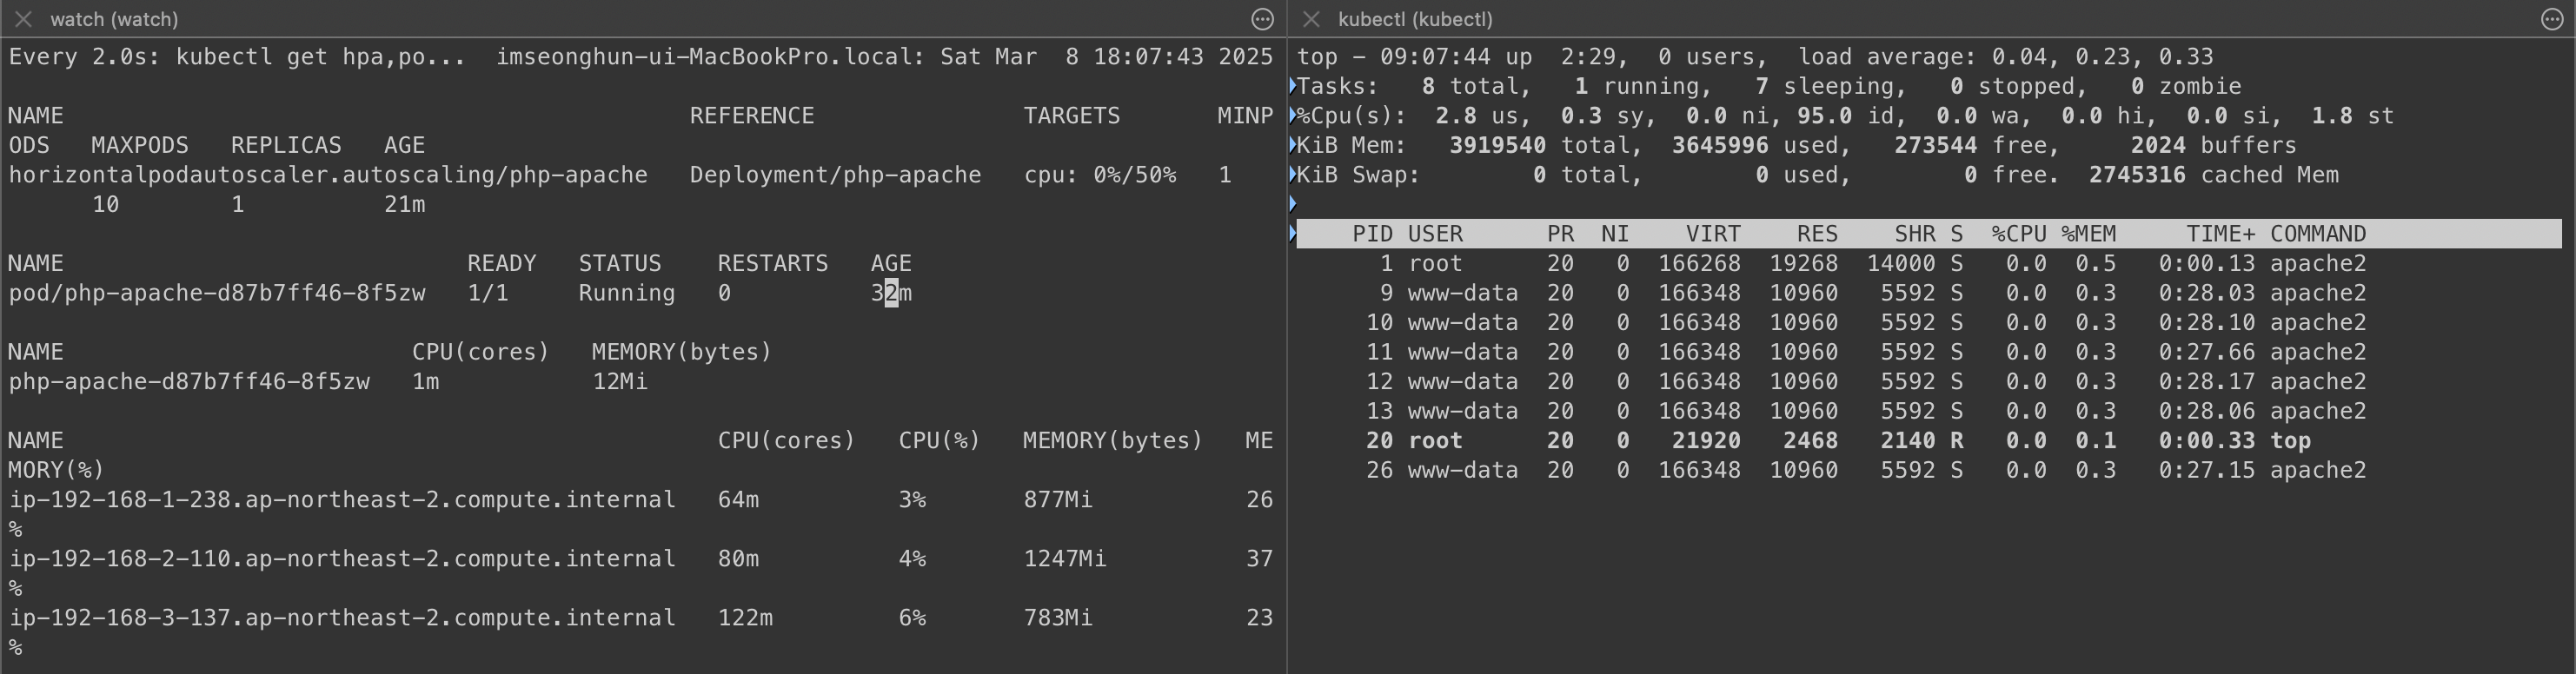
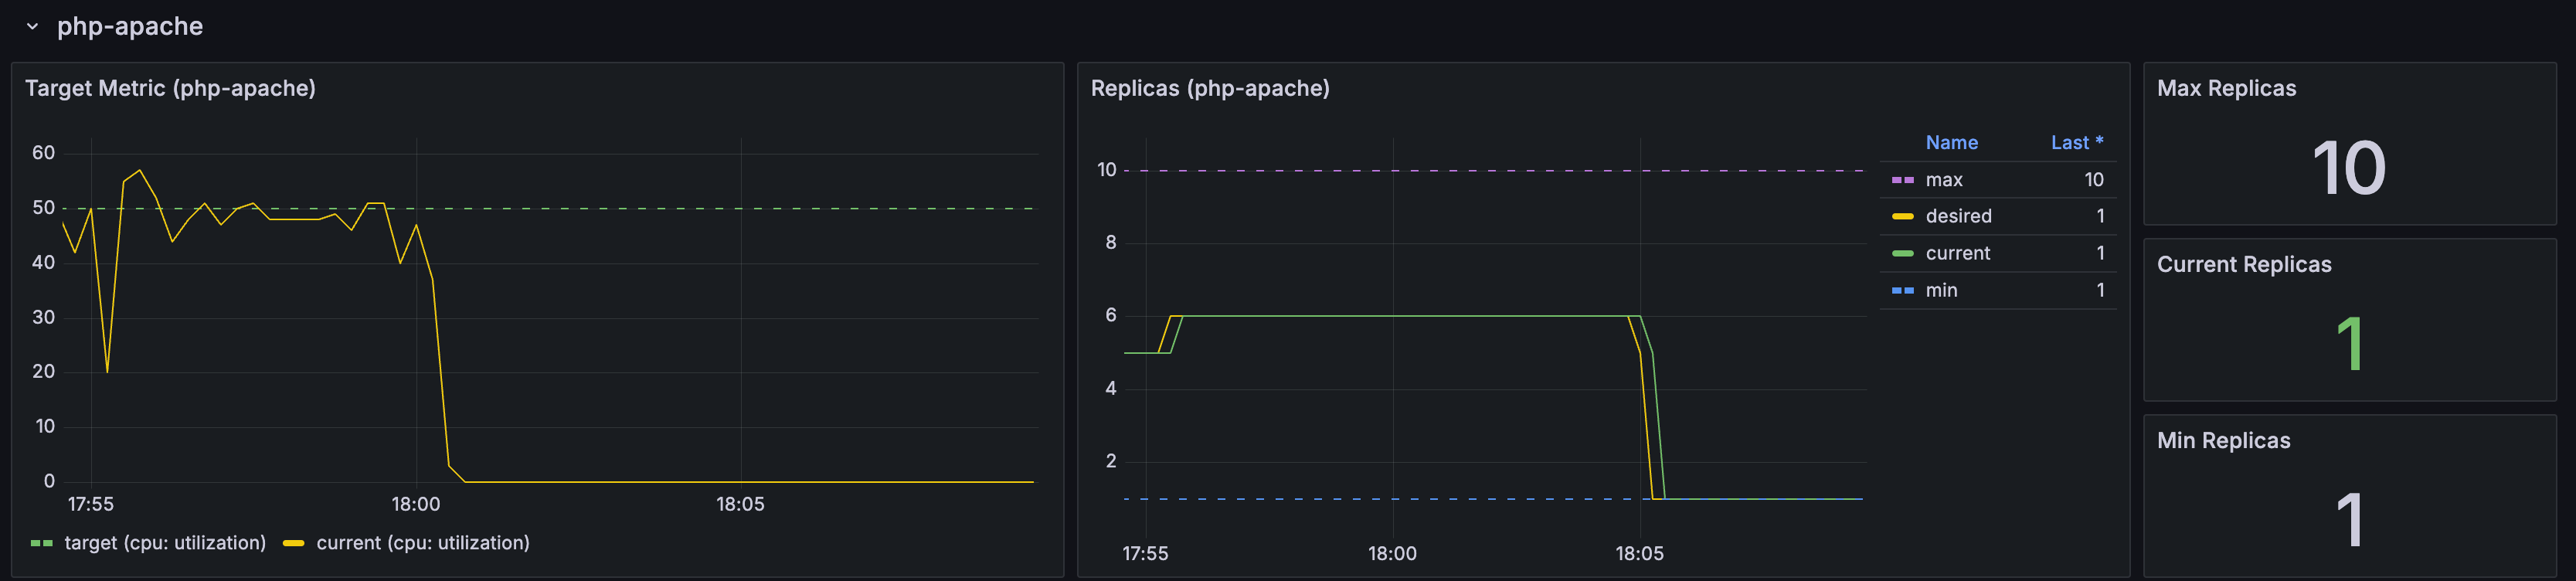
감소 확인
- 정책에 설정되어 있는 것과 같이 부하가 종료되고 5분 뒤에 min pods 값 설정으로 pod 개수가 줄어든 것을 확인할 수 있습니다.
'Cloud > AWS' 카테고리의 다른 글
| [AWS] EKS Autoscaling - VPA (0) | 2025.03.08 |
|---|---|
| [AWS] EKS Autoscaling - KEDA (0) | 2025.03.08 |
| [AWS] EKS Observability (1) | 2025.03.02 |
| [AWS] EKS Storage (0) | 2025.02.23 |
| [AWS] EKS Networkings (2) (0) | 2025.02.16 |
AutoScaling 에 대해
Vertical Pod Autoscaler (VPA) : Pod의 리소스(cpu, mem 등)를 동적으로 증가 또는 감소시켜 성능을 조정
Horizontal Pod Autoscaler (HPA) : 부하에 따라 pod의 개수를 자동으로 추가하거나 제거하여 확장성을 제공
Cluster Autoscaler : 클러스터의 노드를 자동으로 추가하거나 제거하여 전체적인 리소스 사용을 최적화
실습 환경 배포
# YAML 파일 다운로드
curl -O https://s3.ap-northeast-2.amazonaws.com/cloudformation.cloudneta.net/K8S/myeks-5week.yaml

# 변수 지정
CLUSTER_NAME=myeks
SSHKEYNAME=<SSH 키 페이 이름>
MYACCESSKEY=<IAM Uesr 액세스 키>
MYSECRETKEY=<IAM Uesr 시크릿 키>

# CloudFormation 스택 배포
aws cloudformation deploy --template-file myeks-5week.yaml --stack-name $CLUSTER_NAME --parameter-overrides KeyName=$SSHKEYNAME SgIngressSshCidr=$(curl -s ipinfo.io/ip)/32  MyIamUserAccessKeyID=$MYACCESSKEY MyIamUserSecretAccessKey=$MYSECRETKEY ClusterBaseName=$CLUSTER_NAME --region ap-northeast-2

# CloudFormation 스택 배포 완료 후 작업용 EC2 IP 출력
aws cloudformation describe-stacks --stack-name myeks --query 'Stacks[*].Outputs[0].OutputValue' --output text

# 작업용 EC2에서 설치 확인
ssh -i <SSH Key 파일> ec2-user@$(aws cloudformation describe-stacks --stack-name myeks --query 'Stacks[*].Outputs[0].OutputValue' --output test)

# 설치 로그 확인
tail -f /root/create-eks.log

# 설치가 완료되면 Cluster 정보 확인
k cluster-info
k get node --label-columns=node.kubernetes.io/instance-type,eks.amazonaws.com/capacityType,topology.kubernetes.io/zone
k get pod -A
k get pdb -n kube-system
로컬 PC에서 kube_config 업데이트 및 클러스터 정보 확인
## 변수 지정
CLUSTER_NAME=myeks
SSHKEYNAME=<SSH KEY NAME>

## 클러스터 확인
eksctl get cluster

## kube-config 업데이트
aws sts get-caller-identity --query Arn
aws eks update-kubeconfig --name myeks --user-alias <위 명령어 출력 사용자>

## 클러스터 정보 확인
k ns default
k get node --label-columns=node.kubernetes.io/instance-type,eks.amazoneaws.com/capacityType,topology.kubernetes.io/zone
k get pod -A
k get pdb -n kube-system

## EC2 공인 IP 변수 지정
export N1=$(aws ec2 describe-instances --filters "Name=tag:Name,Values=myeks-ng1-Node" "Name=availability-zone,Values=ap-northeast-2a" --query 'Reservations[*].Instances[*].PublicIpAddress' --output text)
export N2=$(aws ec2 describe-instances --filters "Name=tag:Name,Values=myeks-ng1-Node" "Name=availability-zone,Values=ap-northeast-2b" --query 'Reservations[*].Instances[*].PublicIpAddress' --output text)
export N3=$(aws ec2 describe-instances --filters "Name=tag:Name,Values=myeks-ng1-Node" "Name=availability-zone,Values=ap-northeast-2c" --query 'Reservations[*].Instances[*].PublicIpAddress' --output text)
echo $N1, $N2, $N3

## RemoteAccess ID 변수 지정
aws ec2 describe-security-groups --filters "Name=group-name,Values=*remoteAccess*" | jq
export MNSGID=$(aws ec2 descirbe-security-groups --filters "Name=group-name,Values=*remoteAccess*" --query 'SecurityGroups[*].GroupId' --output text)

## 원격 접속을 위한 방화벽 룰 추가
aws ec2 authorize-security-group-ingress --group-id $MNSGID --protocol '-1' --cidr $(curl -s ipinfo.io/ip)32

## 보안 inbound에 사설 IP 룰 추가
aws ec2 authorize-security-group-ingress --group-id $MNSGID --protocol '-1' --cidr 172.20.1.100/32

## 워커 노드 접속 테스트
for i in $N1 $N2 $N3; do echo ">> node $i <<"; ssh -o StrictHostKeyChecking=no ec2-user@$i hostname; echo; done
AWS LoadBalancer Controller, ExternalDNS, gp3 storageclass, kube-ops-view 설치
## aws loadbalancercontroller
helm repo add eks https://aws.github.io/eks-charts
helm install aws-load-balancer-controller eks/aws-load-balancer-controller -n kube-system --set clusterName=$CLUSTER_NAME \
 --set serviceAccount.create=false --set serviceAccout.name=aws-load-balancer-controller

## ExternalDNS
echo $MyDomain
curl -s https://raw.githubusercontent.com/gasida/PKOS/main/aews/externaldns.yaml | Mydomain=$MyDomain MyDnzHostedZoneId=$MyDnzHostedZoneId envsubst | kubectl apply -f -

## gp3 Storage Class
cat <<EOF | kubectl apply -f -
kind: StorageClass
apiVersion: storage.k8s.io/v1
metaata:
  name: gp3
  annotations:
    storageclass.kubernetes.io/is-default-class: "true"
allowVolumeExpansion: true
provisioner: ebs.csi.aws.com
volumeBindingMode: WaitForFirstConsumer
parameters:
  type: gp3
  allowAutoIOPSPerGBIncrease: 'true'
  encrypted: 'true'
  fsType: xfs
EOF

k get sc

## kube-ops-view install
helm repo add geek-cookbook https://geek-cookbook.github.io/charts/
helm install kube-ops-view geek-cookbook/kube-ops-view --version 1.2.2 --set service.main.type=ClusterIP  --set env.TZ="Asia/Seoul" --namespace kube-system

# kubeopsview 용 Ingress 설정
echo $CERT_ARN
cat <<EOF | kubectl apply -f -
apiVersion: networking.k8s.io/v1
kind: Ingress
metadata:
  annotations:
    alb.ingress.kubernetes.io/certificate-arn: $CERT_ARN
    alb.ingress.kubernetes.io/group.name: study
    alb.ingress.kubernetes.io/listen-ports: '[{"HTTPS":443}, {"HTTP":80}]'
    alb.ingress.kubernetes.io/load-balancer-name: $CLUSTER_NAME-ingress-alb
    alb.ingress.kubernetes.io/scheme: internet-facing
    alb.ingress.kubernetes.io/ssl-redirect: "443"
    alb.ingress.kubernetes.io/success-codes: 200-399
    alb.ingress.kubernetes.io/target-type: ip
  labels:
    app.kubernetes.io/name: kubeopsview
  name: kubeopsview
  namespace: kube-system
spec:
  ingressClassName: alb
  rules:
  - host: kubeopsview.$MyDomain
    http:
      paths:
      - backend:
          service:
            name: kube-ops-view
            port:
              number: 8080  # name: http
        path: /
        pathType: Prefix
EOF
설치 확인
## pod 내역 확인
k get pods -n kube-system

## service, endpoint, ingress 확인
k get ingress,ep,svc -n kube-system

## kube-ops-view 접속 정보 확인
echo -e "Kube ops view URL = https://kubeopsview.$MyDomain/#scale=1.5"
open "https://kubeopsview.$MyDomain/#scale=1.5"
프로메테우스 & 그라파나 설치 : Import Dashboard 17900
## helm repo 추가
helm repo add prometheus-community https://prometheus-community.github.io/helm-charts

## 파라미터 파일 생성 : PV / PVC 제외
cat <<EOT > monitor-values.yaml
prometheus:
  prometheusSpec:
    scrapeInterval: "15s"
    evaluationInterval: "15s"
    podMonitorSelectorNilUsesHelmValues: false
    serviceMonitorSelectorNilUsesHelmValues: false
    retention: 5d
    retentionSize: "10GiB"

  # Enable vertical pod autoscaler support for prometheus-operator
  verticalPodAutoscaler:
    enabled: true

  ingress:
    enabled: true
    ingressClassName: alb
    hosts:
      - prometheus.$MyDomain
    paths:
      - /*
    annotations:
      alb.ingress.kubernetes.io/scheme: internet-facing
      alb.ingress.kubernetes.io/target-type: ip
      alb.ingress.kubernetes.io/listen-ports: '[{"HTTPS":443}, {"HTTP":80}]'
      alb.ingress.kubernetes.io/certificate-arn: $CERT_ARN
      alb.ingress.kubernetes.io/success-codes: 200-399
      alb.ingress.kubernetes.io/load-balancer-name: myeks-ingress-alb
      alb.ingress.kubernetes.io/group.name: study
      alb.ingress.kubernetes.io/ssl-redirect: '443'

grafana:
  defaultDashboardsTimezone: Asia/Seoul
  adminPassword: prom-operator
  defaultDashboardsEnabled: false

  ingress:
    enabled: true
    ingressClassName: alb
    hosts:
      - grafana.$MyDomain
    paths:
      - /*
    annotations:
      alb.ingress.kubernetes.io/scheme: internet-facing
      alb.ingress.kubernetes.io/target-type: ip
      alb.ingress.kubernetes.io/listen-ports: '[{"HTTPS":443}, {"HTTP":80}]'
      alb.ingress.kubernetes.io/certificate-arn: $CERT_ARN
      alb.ingress.kubernetes.io/success-codes: 200-399
      alb.ingress.kubernetes.io/load-balancer-name: myeks-ingress-alb
      alb.ingress.kubernetes.io/group.name: study
      alb.ingress.kubernetes.io/ssl-redirect: '443'

kube-state-metrics:
  rbac:
    extraRules:
      - apiGroups: ["autoscaling.k8s.io"]
        resources: ["verticalpodautoscalers"]
        verbs: ["list", "watch"]
  customResourceState:
    enabled: true
    config:
      kind: CustomResourceStateMetrics
      spec:
        resources:
          - groupVersionKind:
              group: autoscaling.k8s.io
              kind: "VerticalPodAutoscaler"
              version: "v1"
            labelsFromPath:
              verticalpodautoscaler: [metadata, name]
              namespace: [metadata, namespace]
              target_api_version: [apiVersion]
              target_kind: [spec, targetRef, kind]
              target_name: [spec, targetRef, name]
            metrics:
              - name: "vpa_containerrecommendations_target"
                help: "VPA container recommendations for memory."
                each:
                  type: Gauge
                  gauge:
                    path: [status, recommendation, containerRecommendations]
                    valueFrom: [target, memory]
                    labelsFromPath:
                      container: [containerName]
                commonLabels:
                  resource: "memory"
                  unit: "byte"
              - name: "vpa_containerrecommendations_target"
                help: "VPA container recommendations for cpu."
                each:
                  type: Gauge
                  gauge:
                    path: [status, recommendation, containerRecommendations]
                    valueFrom: [target, cpu]
                    labelsFromPath:
                      container: [containerName]
                commonLabels:
                  resource: "cpu"
                  unit: "core"
  selfMonitor:
    enabled: true

alertmanager:
  enabled: false
defaultRules:
  create: false
kubeControllerManager:
  enabled: false
kubeEtcd:
  enabled: false
kubeScheduler:
  enabled: false
prometheus-windows-exporter:
  prometheus:
    monitor:
      enabled: false
EOT
cat monitor-values.yaml

## helm 배포
helm install kube-prometheus-stack prometheus-community/kube-prometheus-stack --version 69.3.1 \
-f monitor-values.yaml --create-namespace --namespace monitoring

## helm 확인
helm get values -n monitoring kube-prometheus-stack

## 프로메테우스 웹 접속
open "https://prometheus.$MyDomain"

## 그라파나 웹 접속
open "https://grafana.$MyDomain"

## Loadbalancer binding 확인
k get targetgroupbindings.elbv2.k8s.aws -A
EKS Node Viewer 설치
- 노드 할당 가능 용량과 요청 request 리소스 표시, 실제 파드 사용량은 아님
- Node 마다 할당 가능한 용량과 스케줄링된 Pod의 리소스 중 request 값을 표시한다.
- 실제 Pod 리소스 사용량은 아님
## MAC 설치
brew tap aws tap
brew install eks-node-viewer

## Linux 설치
go install github.com/awslabs/eks-node-viewer/cmd/eks-node-viewer@latest
- 사용
## 기본
eks-node-viewer

## CPU / MEM 표시
eks-node-viewer --resources cpu,memory
eks-node-viewer --resources cpu,memory --extra-labels eks-node-viewer/node-age

## Label로 조회
eks-node-viewer --extra-labels topology.kubernetes.io/zone
eks-node-viewer --extra-labels kubernetes.io/arch

## CPU sort
eks-node-viewer --node-sort=eks-node-viewer/node-vpu-usage-dsc

## karpenter node만
eks-node-viewer --node-selector "karpenter.sh/provisioner-name"
HPA - Horizontal Pod Autoscaler
- 그라파나(22128,22251) 대시보드 import
- hpa-example (CPU 과부하 연산 수행)
# Run and expose php-apache server
cat << EOF > php-apache.yaml
apiVersion: apps/v1
kind: Deployment
metadata:
  name: php-apache
spec:
  selector:
    matchLabels:
      run: php-apache
  template:
    metadata:
      labels:
        run: php-apache
    spec:
      containers:
      - name: php-apache
        image: registry.k8s.io/hpa-example
        ports:
        - containerPort: 80
        resources:
          limits:
            cpu: 500m
          requests:
            cpu: 200m
---
apiVersion: v1
kind: Service
metadata:
  name: php-apache
  labels:
    run: php-apache
spec:
  ports:
  - port: 80
  selector:
    run: php-apache
EOF
kubectl apply -f php-apache.yaml

# 확인
kubectl exec -it deploy/php-apache -- cat /var/www/html/index.php
...

# 모니터링 : 터미널2개 사용
watch -d 'kubectl get hpa,pod;echo;kubectl top pod;echo;kubectl top node'
kubectl exec -it deploy/php-apache -- top

# [운영서버 EC2] 파드IP로 직접 접속
PODIP=$(kubectl get pod -l run=php-apache -o jsonpath="{.items[0].status.podIP}")
curl -s $PODIP; echo
- 부하 발생 확인
HPA 정책 생성 후 오토 스케일링 테스트
- 증가 시 기본 대기 시간 (30초), 감소 시 기본 대기 시간 (5분)
cat <<EOF | kubectl apply -f -
apiVersion: autoscaling/v2
kind: HorizontalPodAutoscaler
metadata:
  name: php-apache
spec:
  scaleTargetRef:
    apiVersion: apps/v1
    kind: Deployment
    name: php-apache
  minReplicas: 1
  maxReplicas: 10
  metrics:
  - type: Resource
    resource:
      name: cpu
      target:
        averageUtilization: 50
        type: Utilization
EOF

## 확인
k describe hpa

## HPA 설정 확인
k get hpa php-apache -o yaml | k neat

## 반복 접속 1 [운영 EC2]
while true; do curl -s $PODIP; sleep 0.5; done
- 부하 발생 시 Pod 생성 확인
감소 확인
- 정책에 설정되어 있는 것과 같이 부하가 종료되고 5분 뒤에 min pods 값 설정으로 pod 개수가 줄어든 것을 확인할 수 있습니다.
'Cloud > AWS' 카테고리의 다른 글
| [AWS] EKS Autoscaling - VPA (0) | 2025.03.08 |
|---|---|
| [AWS] EKS Autoscaling - KEDA (0) | 2025.03.08 |
| [AWS] EKS Observability (1) | 2025.03.02 |
| [AWS] EKS Storage (0) | 2025.02.23 |
| [AWS] EKS Networkings (2) (0) | 2025.02.16 |